elps5406-sup-0001-SupMat
advertisement

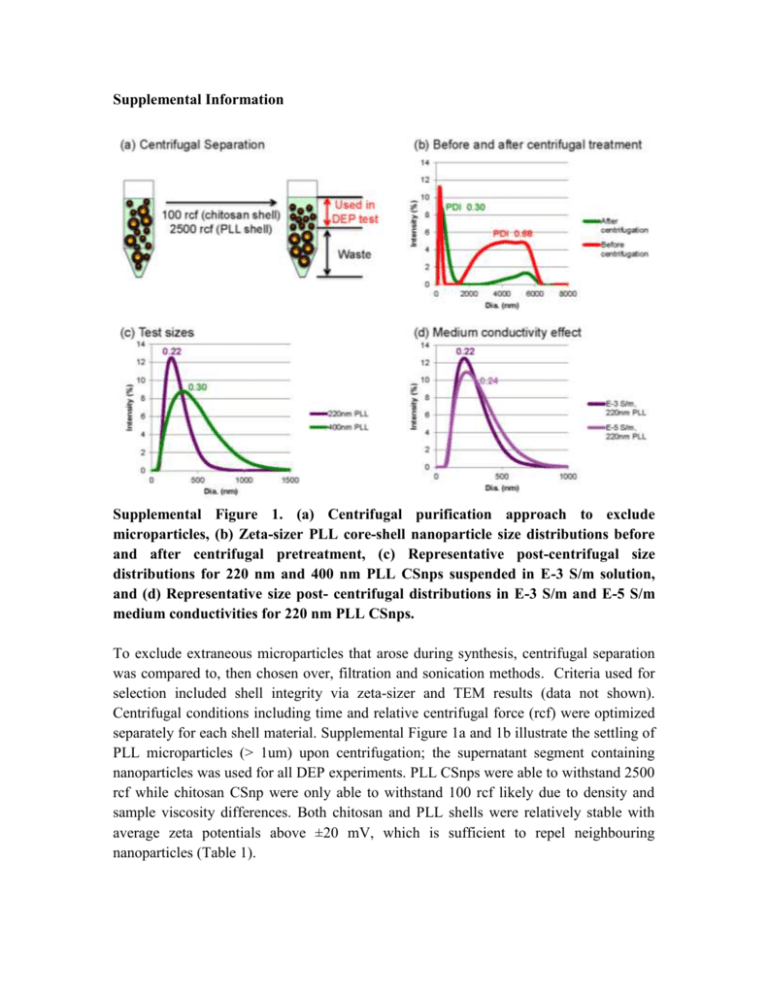
Supplemental Information Supplemental Figure 1. (a) Centrifugal purification approach to exclude microparticles, (b) Zeta-sizer PLL core-shell nanoparticle size distributions before and after centrifugal pretreatment, (c) Representative post-centrifugal size distributions for 220 nm and 400 nm PLL CSnps suspended in E-3 S/m solution, and (d) Representative size post- centrifugal distributions in E-3 S/m and E-5 S/m medium conductivities for 220 nm PLL CSnps. To exclude extraneous microparticles that arose during synthesis, centrifugal separation was compared to, then chosen over, filtration and sonication methods. Criteria used for selection included shell integrity via zeta-sizer and TEM results (data not shown). Centrifugal conditions including time and relative centrifugal force (rcf) were optimized separately for each shell material. Supplemental Figure 1a and 1b illustrate the settling of PLL microparticles (> 1um) upon centrifugation; the supernatant segment containing nanoparticles was used for all DEP experiments. PLL CSnps were able to withstand 2500 rcf while chitosan CSnp were only able to withstand 100 rcf likely due to density and sample viscosity differences. Both chitosan and PLL shells were relatively stable with average zeta potentials above ±20 mV, which is sufficient to repel neighbouring nanoparticles (Table 1). In the uncorrected circuit, only nDEP was observed over all frequencies tested from 100kHz to 80MHz. The measured nDEP magnitudes increased from 100kHz up to ~62MHz and then nDEP decreased between ~62MHz and 80MHz. To verify the observed phenomena, we tested CSnp (400nm PLL shell) at 60MHz and then turned off the field to see natural particle dispersion. In addition, the frequency was switched from 60MHz to 100kHz, which illustrated weak nDEP, and the results are shown in Supplemental Figure 2. Supplemental Figure 2. Comparison between the free diffusion (a-c) and low frequency at 100kHz (d-f) of core-shell nanoparticle polarization after 20 second of field-on at 60MHz. 5Vpp at 60MHz was applied for 20 second and then free diffusion at field-off (c) and low frequency field-on (f) were observed for 80 second after. Qualitatively, the nDEP phenomena was verified by selectively changing the applied frequency. These experiments were done because a single nanoparticle’s size is smaller than the microscope optical limitation making pDEP harder to be distinguished next to the light blocking metal electrodes. Therefore, the electric field was applied at 60 MHz, which induced the maximum nDEP, and then switched to either (1) turn off the electric field altogether (Figure 2 a, b, and c), or (2) change the applied frequency to 100kHz (Figure 2 d, e, and f), whereby a minimum nDEP was observed. By comparing these two cases and other frequencies, we qualitatively determined that pDEP was inadvertently overlooked in the experimental data. If the CSnp did experience pDEP, then the CSnp cluster at the quadrapole center (see b and e) would disperse more rapidly that via diffusion (Figure 2 a, b, and c) to the electric field maxima (electrode edge) region. The field off condition was tested because in this case, only free diffusion acted upon the particles. In Figure 2 c, once the electric field was off, particle clusters became more dispersed compared to the 60 MHz in Figure 2b. A slight hydrodynamic force resulted in the system after turning off the electric field; this small flow caused the cluster to move slightly to the right from the center. However, in Figure 2f, the cluster still remain at the center which indicates no pDEP forces and possibly weak nDEP at 100 kHz. In fact, cluster position remained at the center and displayed slightly reduced cluster size compared to 60 MHz. Device geometry effect was additionally explored with the uncorrected circuit. Three device geometries were tested including quadrapole electrodes with (a) 25 μm spacing, (b) 200 μm spacing, and (c) T-configuration electrodes with 100 μm spacing. The gas core-PLL shell nanoparticles with mean diameter of 400nm displayed similar maximum peak responses near 60MHz as shown in Supplemental Figure 4. This indicates that the CSnps’ unusual maximum peak nDEP responses are due to CSnp properties, not due to the device geometry (25 μm vs. 200 μm) nor due to device geometry (quadrapole vs. Tconfiguration electrodes). 0.0 Arbitary Value -0.2 -0.4 25um gap quadrapole electrodes 200um gap quadrapole electrodes -0.6 T-device w/ 100um gap -0.8 -1.0 1.E+05 2.E+07 4.E+07 6.E+07 Frequency (Hz) 8.E+07 Supplemental Figure 3. Device effect on CSnp (gas core-PLL shell nanoparticles) on measured nDEP responses as a function of frequency at 5Vpp. In Supplemental Figure 5, a control experiment was conducted by a reviewer’s comment to conclude further on the effect of the gas core. In order to compare the gas core effect with solid core material, we chose polystyrene beads (~300nm) coated with PLL shell materials. The measured nDEP from solid core displayed similar responses that included maximum nDEP peak, but the maximum frequency switched to 70MHz. Because DEP responses are determined by dielectric properties (permittivity & conductivity) and both gas core and the solid PS beads are insulator. Thus, the resulting phenomena were similar. However, the altered maximum peak might be an indicator that showed difference between the solid PS and the gas core. 0.0 Arbitary Value -0.2 -0.4 400nm PLL -0.6 300nm PS beads coated with PLL -0.8 -1.0 1.E+05 2.E+07 4.E+07 6.E+07 Frequency (Hz) 8.E+07 Supplemental Figure 4. Comparison between the gas core and solid polystyrene (PS) core materials within similar size ranges. Measured nDEP responses as a function of frequency at 5Vpp within 25 μm gap quadrapole electrodes .


