Supplementary Figures Supplementary Figure 1 Distorted Grid
advertisement
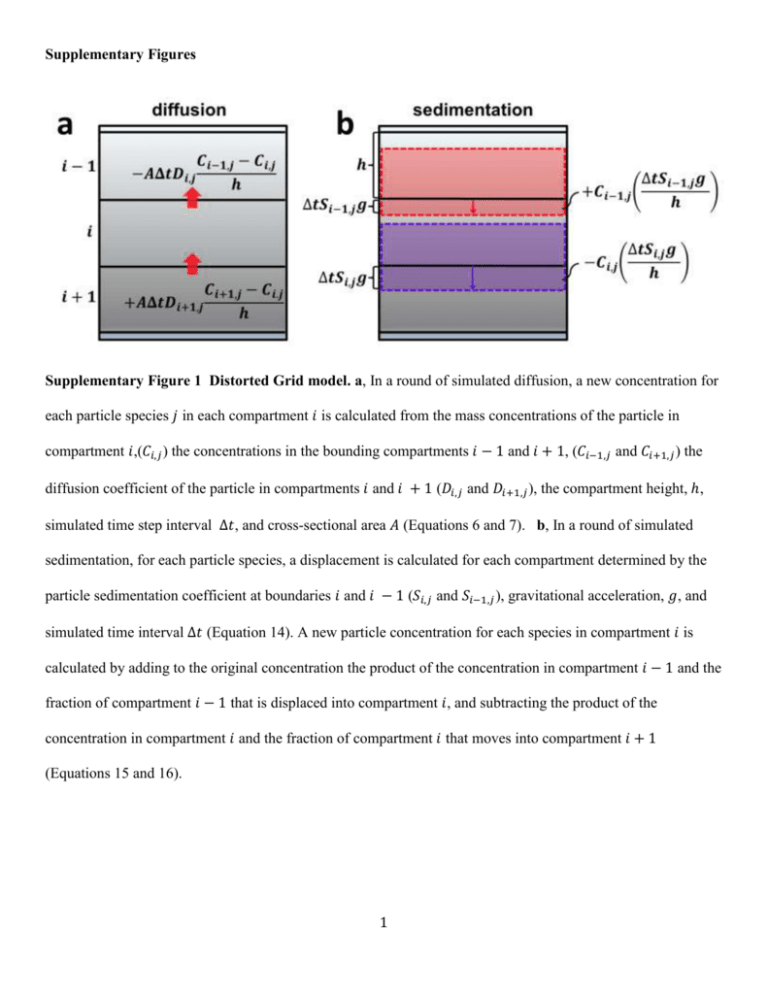
Supplementary Figures Supplementary Figure 1 Distorted Grid model. a, In a round of simulated diffusion, a new concentration for each particle species 𝑗 in each compartment 𝑖 is calculated from the mass concentrations of the particle in compartment 𝑖,(𝐶𝑖,𝑗 ) the concentrations in the bounding compartments 𝑖 − 1 and 𝑖 + 1, (𝐶𝑖−1,𝑗 and 𝐶𝑖+1,𝑗 ) the diffusion coefficient of the particle in compartments 𝑖 and 𝑖 + 1 (𝐷𝑖,𝑗 and 𝐷𝑖+1,𝑗 ), the compartment height, ℎ, simulated time step interval Δ𝑡, and cross-sectional area 𝐴 (Equations 6 and 7). b, In a round of simulated sedimentation, for each particle species, a displacement is calculated for each compartment determined by the particle sedimentation coefficient at boundaries 𝑖 and 𝑖 − 1 (𝑆𝑖,𝑗 and 𝑆𝑖−1,𝑗 ), gravitational acceleration, 𝑔, and simulated time interval Δ𝑡 (Equation 14). A new particle concentration for each species in compartment 𝑖 is calculated by adding to the original concentration the product of the concentration in compartment 𝑖 − 1 and the fraction of compartment 𝑖 − 1 that is displaced into compartment 𝑖, and subtracting the product of the concentration in compartment 𝑖 and the fraction of compartment 𝑖 that moves into compartment 𝑖 + 1 (Equations 15 and 16). 1 Supplementary Figure 2 Cryosection validation method. To experimentally validate the model a cylindrical paraffin cell was created as depicted here and described in methods. Particle suspension was added to the well. After allowing transport to proceed for selected lengths of time the well and suspension were flash frozen, and the frozen suspension pellet was extracted and cryosectioned. Thawed cryosections were analyzed by spectrophotometry and material concentrations in section samples were determined by spectrophotometry using a standard curve obtained at λmax for the material/media combination. 2 Supplementary Figure 3 Volume size distributions from DLS. Histograms distribution of agglomerate species size (𝑑H ) distribution for volume size distribution from DLS. 3 Supplementary Figure 4 DG vs VCM-ISDD. Comparison of deposited fraction predicted by DG and VCMISDD for SiO2, Fe2O3, TiO2 and CeO2 ENMs (𝐶0 = 0.1 mg ml-1, column height = 3 mm) with 𝑑H = volumeaveraged mean (Table 1). Distorted grid simulations performed assuming negligible particle-cell binding (reflective boundary condition), consistent with typical non-specific dissociation constants . 4


