DI0(calculus10)
advertisement
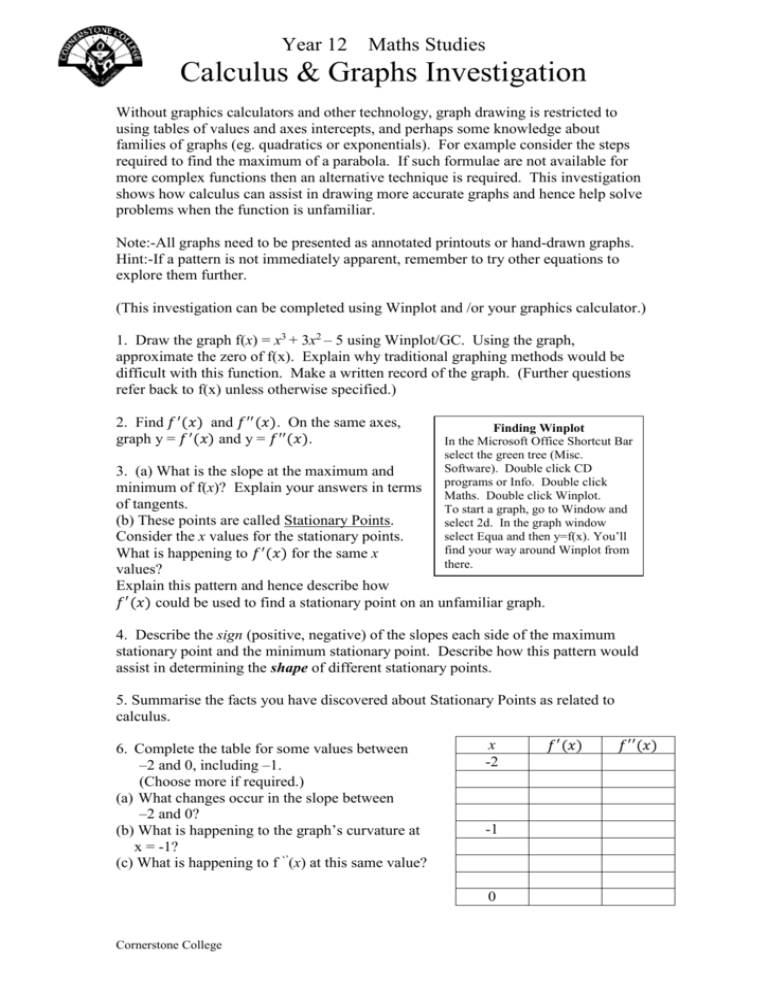
Year 12 Maths Studies Calculus & Graphs Investigation Without graphics calculators and other technology, graph drawing is restricted to using tables of values and axes intercepts, and perhaps some knowledge about families of graphs (eg. quadratics or exponentials). For example consider the steps required to find the maximum of a parabola. If such formulae are not available for more complex functions then an alternative technique is required. This investigation shows how calculus can assist in drawing more accurate graphs and hence help solve problems when the function is unfamiliar. Note:-All graphs need to be presented as annotated printouts or hand-drawn graphs. Hint:-If a pattern is not immediately apparent, remember to try other equations to explore them further. (This investigation can be completed using Winplot and /or your graphics calculator.) 1. Draw the graph f(x) = x3 + 3x2 – 5 using Winplot/GC. Using the graph, approximate the zero of f(x). Explain why traditional graphing methods would be difficult with this function. Make a written record of the graph. (Further questions refer back to f(x) unless otherwise specified.) 2. Find 𝑓 ′ (𝑥) and 𝑓 ′′ (𝑥). On the same axes, graph y = 𝑓 ′ (𝑥) and y = 𝑓 ′′ (𝑥). Finding Winplot In the Microsoft Office Shortcut Bar select the green tree (Misc. Software). Double click CD programs or Info. Double click Maths. Double click Winplot. To start a graph, go to Window and select 2d. In the graph window select Equa and then y=f(x). You’ll find your way around Winplot from there. 3. (a) What is the slope at the maximum and minimum of f(x)? Explain your answers in terms of tangents. (b) These points are called Stationary Points. Consider the x values for the stationary points. What is happening to 𝑓 ′ (𝑥) for the same x values? Explain this pattern and hence describe how 𝑓 ′ (𝑥) could be used to find a stationary point on an unfamiliar graph. 4. Describe the sign (positive, negative) of the slopes each side of the maximum stationary point and the minimum stationary point. Describe how this pattern would assist in determining the shape of different stationary points. 5. Summarise the facts you have discovered about Stationary Points as related to calculus. 6. Complete the table for some values between –2 and 0, including –1. (Choose more if required.) (a) What changes occur in the slope between –2 and 0? (b) What is happening to the graph’s curvature at x = -1? (c) What is happening to f ‘’(x) at this same value? x -2 -1 0 Cornerstone College 𝑓 ′ (𝑥) 𝑓 ′′ (𝑥) 7. This is an example of a non-stationary point of inflexion. From your findings, summarise the steps for finding a non-stationary inflexion using (a) graphs, (b) algebra. (Remember to explore other functions if the pattern is not clear.) 8. On a new graph, draw g(x) = x3. Investigate the changes in slope between –1 and 1, including 0. Compare your findings with the results of Q3 (stationary points) and Q6 (points of inflexion). Explain how this graph is similar and different to both situations. Consider both 𝑓 ′ (𝑥) and 𝑓 ′′ (𝑥). Classify the curve’s shape accordingly, explaining your choice. 9. Choose and graph any polynomial of degree 3 (a polynomial more complicated than y=kx3). On the graph locate the stationary points and any non-stationary points of inflexion. Complete the supporting calculus algebra to verify your findings. 10. Application A triangular pen is enclosed by two fences, AB and BC, each of 50 metres. The third side, 2x, is a river frontage. The area is given by A( x) x 2500 x 2 (a) Graph the function and annotate the features of the graph that are important to this questions (eg. consider the domain of this function for this problem). (b) Find the maximum area (i) using a graph, (ii) using calculus as explored in this investigation. What river frontage gives maximum area? Show all your working. Assessment Criteria Mathematical skills & understanding (with ET) Analysis and interpretation of results and information Ability to make and explain conjectures Communication of mathematical information Organization & presentation Ability to work independently Total: /17 marks Comments: Cornerstone College 0 1 2 3 4 5
