Describing overflow metabolism in yeast using two modeling
advertisement
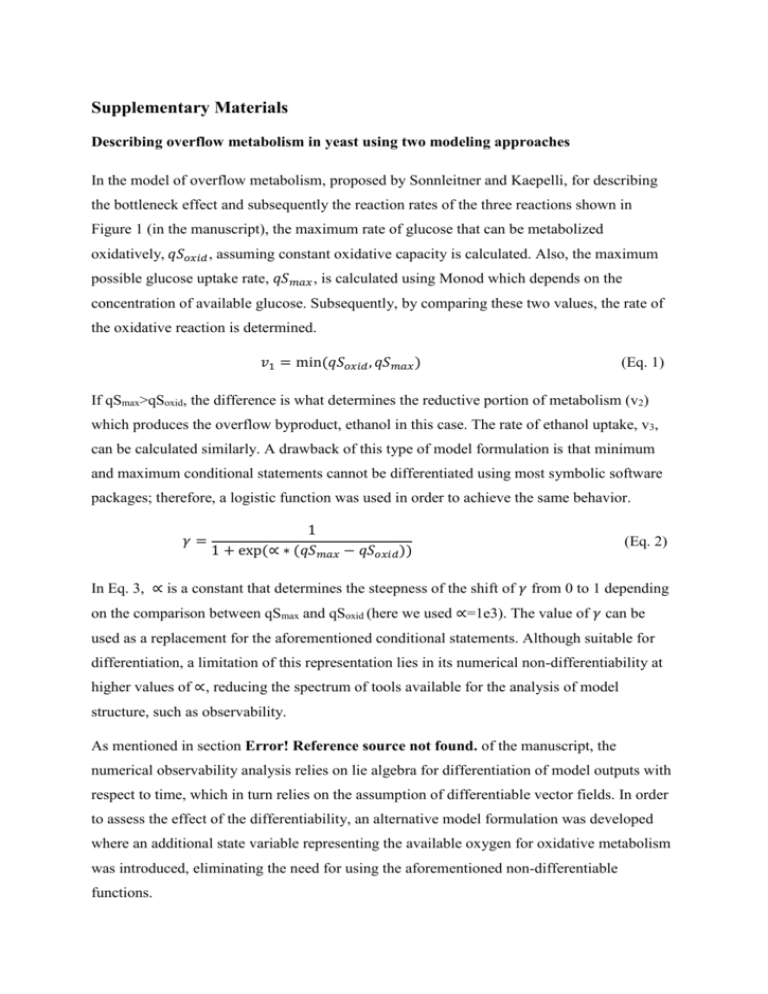
Supplementary Materials Describing overflow metabolism in yeast using two modeling approaches In the model of overflow metabolism, proposed by Sonnleitner and Kaepelli, for describing the bottleneck effect and subsequently the reaction rates of the three reactions shown in Figure 1 (in the manuscript), the maximum rate of glucose that can be metabolized oxidatively, 𝑞𝑆𝑜𝑥𝑖𝑑 , assuming constant oxidative capacity is calculated. Also, the maximum possible glucose uptake rate, 𝑞𝑆𝑚𝑎𝑥 , is calculated using Monod which depends on the concentration of available glucose. Subsequently, by comparing these two values, the rate of the oxidative reaction is determined. 𝑣1 = min(𝑞𝑆𝑜𝑥𝑖𝑑 , 𝑞𝑆𝑚𝑎𝑥 ) (Eq. 1) If qSmax>qSoxid, the difference is what determines the reductive portion of metabolism (v2) which produces the overflow byproduct, ethanol in this case. The rate of ethanol uptake, v3, can be calculated similarly. A drawback of this type of model formulation is that minimum and maximum conditional statements cannot be differentiated using most symbolic software packages; therefore, a logistic function was used in order to achieve the same behavior. 𝛾= 1 1 + exp(∝ ∗ (𝑞𝑆𝑚𝑎𝑥 − 𝑞𝑆𝑜𝑥𝑖𝑑 )) (Eq. 2) In Eq. 3, ∝ is a constant that determines the steepness of the shift of 𝛾 from 0 to 1 depending on the comparison between qSmax and qSoxid (here we used ∝=1e3). The value of 𝛾 can be used as a replacement for the aforementioned conditional statements. Although suitable for differentiation, a limitation of this representation lies in its numerical non-differentiability at higher values of ∝, reducing the spectrum of tools available for the analysis of model structure, such as observability. As mentioned in section Error! Reference source not found. of the manuscript, the numerical observability analysis relies on lie algebra for differentiation of model outputs with respect to time, which in turn relies on the assumption of differentiable vector fields. In order to assess the effect of the differentiability, an alternative model formulation was developed where an additional state variable representing the available oxygen for oxidative metabolism was introduced, eliminating the need for using the aforementioned non-differentiable functions. Similar to the classical model, the modified model makes the assumption that glucose uptake proceeds via two pathways. Part is metabolized oxidatively (v1) and part reductively (v2), with ethanol being the end product of reductive energy metabolism. Ethanol can be metabolized under oxidative conditions only (v3). The two models differ with respect to the mechanism under which it is decided when reductive metabolism occurs. While the classical model makes use of conditional statements, the modified model uses an additional state variable for representing the available oxidative capacity to realize the metabolic switch, in addition to one additional reaction representing the conversion of free oxygen to oxygen available for the oxidative reactions (v4). Suppl. Table 1 shows the pseudo-stoichiometric matrix used for the model. The state-variable correlating with the amount of available oxidative capacity (O2_int [mol/l]) is a requirement for reactions v1 and v3. Although, the rate limiting step in the electron transport chain has been shown to be quinone migration rather than the concentration of the components 28. The proposed method of modeling the oxidative capacity can be considered a simplification which is able to describe the limited oxidative capacity without the need for model complication with non-differentiable functions. Supple. Table 1. Stoichiometric matrix describing the reaction network for modeling overflow metabolism in yeast. States (x) v1 v2 v3 v4 S -1 -1 0 0 X b g l 0 E 0 j -1 0 CO2 c h m 0 O2_int -a 0 -k 1 NH3 -b*NX -g*NX -l*NX 0 H2O d i n 0 O2_ext 0 0 0 -1 Analogous to the classical model 18, the yield coefficients b, g, l, as well as the elemental composition of biomass, NX, HX, and OX are given as model parameters, from which the other unknown parameters can be calculated using the system of linear equations E*S=0 where E is a matrix containing the elemental composition of all reaction species (not shown). Substitution of the calculated yield parameters results in a stoichiometric matrix that can be used in Eq. 1 (in the main text of the manuscript). In order to derive the dynamic reaction rates, v1 - v4 [mol/h], the specific intracellular oxidative capacity [gO2/gX] using the state variable O2int is defined: 𝑔𝑂2 (𝑡) = 𝑂2𝑖𝑛𝑡 (𝑡) ∗ 𝑉𝐿 (𝑡) 𝑔𝑂2 (𝑡) 𝑐𝑋𝐿 (𝑡) 𝑂2𝑖𝑛𝑡 (𝑡) ∗ 𝑉𝐿 (𝑡) 𝑂2𝑖𝑛𝑡 (𝑡) ∗ 𝑉𝐿 (𝑡) = 𝑐𝑋𝐿 (𝑡) 𝑐𝑋𝐿 (𝑡) (Eq. 3) The specific glucose uptake rate, 𝑞𝑆 (𝑡) [gS/gX/h], 𝑞𝑆 (𝑡) = 𝑞𝑠_𝑚𝑎𝑥 ∙ 𝑐𝑆 (𝑡) 𝑐𝑆 (𝑡) + 𝐾𝑆 (Eq. 4) is calculated using the maximum specific glucose uptake rate parameter and is limited by the availability of glucose in the media according to Monod kinetics. The oxidative portion of glucose metabolism, 𝑞𝑆_𝑜𝑥𝑖𝑑 (𝑡) [gS/gX/h], 𝑞𝑆_𝑜𝑥𝑖𝑑 (𝑡) = 𝑞𝑠 (𝑡) ∙ 𝑔𝑂2 (𝑡) 𝑔𝑂2 (𝑡) 𝑔𝑂2 (𝑡) 𝑔𝑂2 (𝑡) + 𝐾𝑂 𝑔𝑂2 (𝑡) + 𝐾𝑂 𝑔𝑂2 (𝑡) + 𝐾𝑂 (Eq. 5) is dependent on the oxidative capacity and 𝐾𝑂 [gO2/gX], a saturation constant. The reductive portion of the glucose metabolism, 𝑞𝑠_𝑟𝑒𝑑 (𝑡) [gS/gX/h] is the difference between glucose uptake rate and the oxidative portion of it. 𝑞𝑆_𝑟𝑒𝑑 (𝑡) = 𝑞𝑠 (𝑡) − 𝑞𝑆_𝑜𝑥𝑖𝑑 (𝑡) (Eq. 6) Ethanol uptake is considered to be limited by the availability of oxidative capacity and ethanol. In addition, ethanol uptake is inhibited by the availability of glucose. 𝑞𝐸_𝑢𝑝𝑡 (𝑡) = 𝑞𝐸_𝑢𝑝𝑡_𝑚𝑎𝑥 (𝑡) ∙ 𝑐𝑋 (𝑡) ∙ 𝑐𝐸 (𝑡) 𝑐𝐸 (𝑡) 𝑐𝐸 (𝑡) 𝑐𝐸 (𝑡) + 𝐾𝐸 𝑐𝐸 (𝑡) + 𝐾𝐸 𝑐𝐸 (𝑡) + 𝐾𝐸 ∙ 𝑔𝑂2 (𝑡) 𝑔𝑂2 (𝑡) 𝑔𝑂2 (𝑡) 𝑔𝑂2 (𝑡) + 𝐾𝑂 𝑔𝑂2 (𝑡) + 𝐾𝑂 𝑔𝑂2 (𝑡) + 𝐾𝑂 ∙ (1 − (Eq. 7) 𝑐𝑆 (𝑡) ) 𝑐𝑆 (𝑡) + 𝐾𝐼 The specific rate of oxygen uptake by the cells, 𝑞𝑂2 (𝑡) [mmol O2/gX/h], 𝑞𝑂2 (𝑡) = 𝑞𝑂2_𝑚𝑎𝑥 ∙ (1 − 𝑔𝑂2 (𝑡) ) 𝑔𝑂2_𝑚𝑎𝑥 (Eq. 8) is given by the maximum possible uptake rate parameter, 𝑞𝑂2_𝑚𝑎𝑥 [mmol O2/gX/h], and is inhibited by the available oxidative capacity, 𝑔𝑂2 (𝑡). Using the derived terms of Eqs. 3-8 the reaction rate vector, v [mol/l/h], can be defined: 𝑞𝑆𝑜𝑥𝑖𝑑 (𝑡) ∗ 𝑐𝑋 (𝑡) / 𝑀𝑊𝑆 (𝑡) ∗ 𝑐𝑋 (𝑡) / 𝑀𝑊𝑆 𝑞 𝒗 = 𝑆_𝑟𝑒𝑑 𝑞𝐸_𝑢𝑝𝑡 (𝑡) ∗ 𝑐𝑋 (𝑡) / 𝑀𝑊𝐸 [ 𝑞𝑂2 (𝑡) ∗ 𝑐𝑋 (𝑡) ∗ 1𝑒 − 3 ] (Eq. 9) The carbon dioxide evolution rate 𝐶𝐸𝑅(𝑡) [mol/l/h] is given by the product of the fourth row of the stoichiometric matrix, S, and the reaction rate vector, v. 𝐶𝐸𝑅(𝑡) = 𝑆(5, : ) ∗ 𝒗 (Eq. 10) Similarly, the observable volumetric oxygen uptake (OUR) rate can be calculated by multiplication of the eighth row of S and v. Assuming that the rate of change of dissolved O2 and CO2 concentrations is negligible when compared to the biological activity, OUR and CER can be set equal to the respective transfer rates and can be used in Eq. 1 (main text) in the Q term. An additional state variable for describing the culture volume can be used, so that volume change as a result of feeding can be considered: 𝑑𝑉𝐿 (𝑡) = 𝐹𝑖𝑛 = 𝐹𝑔𝑙𝑐 + 𝐹𝑏𝑎𝑠𝑒 𝑑𝑡 (Eq. 11) The other differential equations of the system are given by Eq. 1 (main text). All of the parameters of this modified model are identical to the classical model as reported by Sonnleitner and Kaepelli, except two additional parameters which are provided in Suppl. Table 2. Suppl. Table 2. Additional parameters of the modified S. cerevisiae model. Symbol Description Value Units 𝑔𝑂2_𝑚𝑎𝑥 Maximum available oxidative capacity 1e-3 [gO/gX] 𝐾𝑂 Saturation constant for oxygen uptake 1e-4 [g/l] Comparison between the classical and modified S. cerevisiae models A difference between the classical and modified models arises from the smoothness of the switch between ethanol uptake and ethanol production. In the presented modified model of overflow metabolism, simultaneous ethanol consumption and uptake is possible. However, during the oxido-reductive phase, the rate of ethanol uptake is much smaller than ethanol production due to the inhibition of ethanol uptake by glucose. Consequently, the respiration rates (OUR and CER) are affected by the initial ethanol concentration to a small degree. When only respiratory rates are measured, the system represented by the modified model shows full rank observability conditions also during the ethanol production phase whereas the classical model does not show full rank during this phase. Despite the full-rank conditions of the modified model, the magnitude of the observability index is very low (close to zero) due to the small ratio of the rate of ethanol consumption to uptake, reflecting the fact that the available information about the initial ethanol concentration in respiratory rates is very low. In this respect, both models behave similarly with respect to observability. Suppl. Figure 1. Observability analysis for the modified model of overflow metabolism in S. cerevisiae. A: When respiratory rates and ethanol concentration are measured, the system is observable. B: With only respiratory rates as measurements, the rank conditions shows that the system is observable, but the observability index during ethanol production phase is close to zero, indicating poor observability. Suppl. Table 3. Comparison of estimation accuracy by full-horizon observer using two different models for four different measurement configurations. Case Measured Classical model (non-differentiable) Modified model (differentiable) (NRMSE %) (NRMSE %) Biomass Glucose Ethanol Volume Biomass Glucose Ethanol Volume <0.5 <0.5 --- --- <0.5 <0.5 --- --- (a) OUR,CER,cE (b) OUR,CER 1.0 0.6 0.8 --- 0.9 0.5 0.8 --- (c) OUR,CER,cE 2.7 4.1 --- 5.2 3.1 5.5 --- 11 (d) OUR,CER 12.2 5.3 8.4 53 11 4.3 7.5 49 As shown in Suppl. Table 3, comparing the estimation errors obtained by the classical vs. modified S. cerevisiae models, generally similar estimation errors are observed for both models across the four different measurement and estimation configurations. For case (c), the classical model resulted in better estimation errors for volume. However, as both models performed otherwise similar, we believe the difference not to be significant, especially that the NRMSE values for cases (c) and (d) varied ±5% between different estimation runs. Therefore, the soft-sensor estimations do not appear to be significantly affected by the choice of process model and the issue of differentiability of model equations. Differentiability is not expected to play a significant role since the observer algorithm only considers the inputoutput behavior of the model and employs a derivative-free genetic optimization algorithm.

