Using Simulations to Confirm the Work of Thomson and Rutherford
advertisement
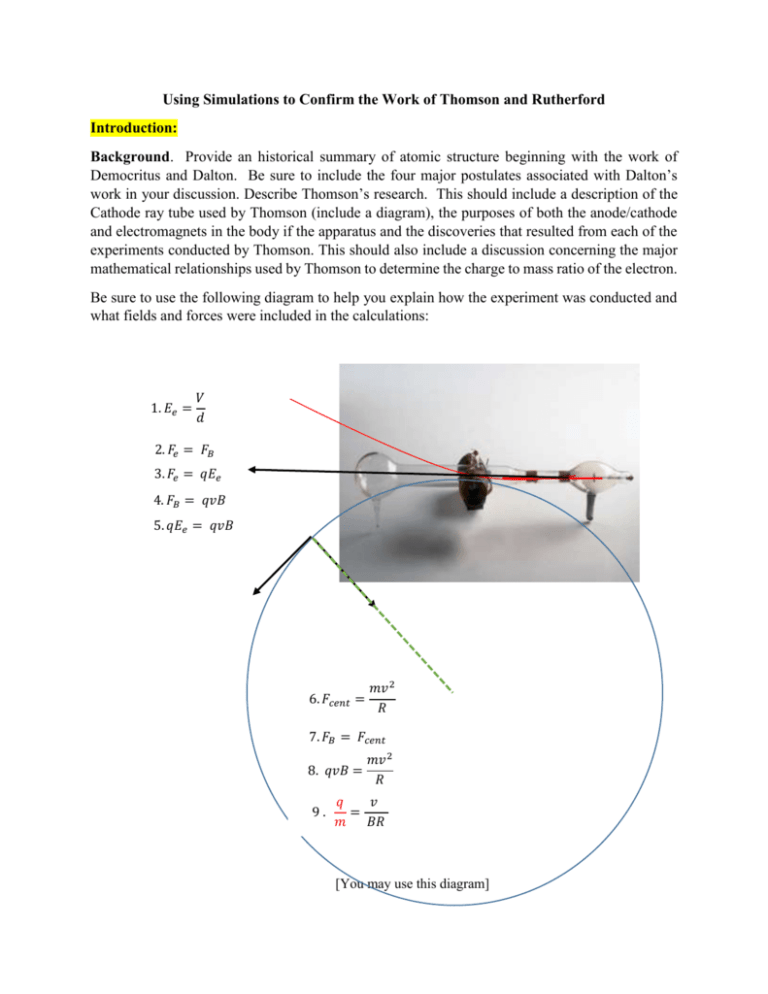
Using Simulations to Confirm the Work of Thomson and Rutherford Introduction: Background. Provide an historical summary of atomic structure beginning with the work of Democritus and Dalton. Be sure to include the four major postulates associated with Dalton’s work in your discussion. Describe Thomson’s research. This should include a description of the Cathode ray tube used by Thomson (include a diagram), the purposes of both the anode/cathode and electromagnets in the body if the apparatus and the discoveries that resulted from each of the experiments conducted by Thomson. This should also include a discussion concerning the major mathematical relationships used by Thomson to determine the charge to mass ratio of the electron. Be sure to use the following diagram to help you explain how the experiment was conducted and what fields and forces were included in the calculations: 1. 𝐸𝑒 = 𝑉 𝑑 2. 𝐹𝑒 = 𝐹𝐵 3. 𝐹𝑒 = 𝑞𝐸𝑒 4. 𝐹𝐵 = 𝑞𝑣𝐵 5. 𝑞𝐸𝑒 = 𝑞𝑣𝐵 6. 𝐹𝑐𝑒𝑛𝑡 = 𝑚𝑣 2 𝑅 7. 𝐹𝐵 = 𝐹𝑐𝑒𝑛𝑡 8. 𝑞𝑣𝐵 = 9. 𝑚𝑣 2 𝑅 𝑞 𝑣 = 𝑚 𝐵𝑅 [You may use this diagram] In a similar fashion, provide the reader with a summary of the research conducted by Rutherford, Geiger and Marsden (1909). Use the Rutherford summary paper provided in the atomic structure webpage to provide the basic information concerning their work This should include a diagram of the apparatus, why they decided to bombard the metal films with alpha particles instead of beta particles and a summary of their major findings. [You may use this diagram] Describe, by drawing a series of lines through the following gold atoms, what you think is going on. Keep in mind that the Thomson model (announced in early 1904, but speculated on in print by Thomson as early as 1899) is still the only model of the atom acceptable to the British. Also, remember that Rutherford had been Thomson's student and the two were very close. (J.J.'s son George has many memories, from his childhood, of Rutherford and his wife over for dinner.) So it is quite natural for Rutherford to believe that J.J.'s model was correct. [You may use this diagram] Source of alpha (α ) rays Testable Questions. What is the purpose of each of the investigations you are going to conduct? More specifically, what information from the Thompson and Rutherford experiments are you going to attempt to address? How do each of the simulations you are going to use work. How do you plan on using them to conduct your measurements? Thomson [Description of how the data is going to be collected] Rutherford [Description of how the data is going to be collected] Design: Are one or the other simulations being used in a controlled fashion? That is, does one or both explorations include control, experimental and dependent variables? Be specific as to which variables are involved. What procedures are you going to use? How is the data going to be collected? Types of Analysis: How are the data in each of the experiments going to be analyzed? Keep in mind that all your calculations need to be included in the discussion section of the paper. What kinds of graphing approaches (if any) are going to be used? If you plan on using a scatter plot, make sure you identify at this point what you plan on using for the x and y axes. Also make that point that you plan on conducting a regression analysis. on reporting the correlation coefficients. Results: Data tables What kinds of data are you going to collect? A. In the case of the Thomson experiment my raw data looked like this: Voltage(V) xx.x Magnetic Field (B, µT) xxx Distance: electrodes (mm) x.xx Centripetal Radius (m) .xxx Note that your table you should include the two sets of data you collected. B. In the case of the Rutherford experiment my raw data looked like this: Protons Neutrons 20 30 40 50 60 70 90 Mass number 40 60 80 100 120 140 180 20 30 40 50 60 70 90 Scintillations/window 3 7 7 10 18 17 30 5 3 9 13 11 20 23 μ 4 6 10 12 11 19 16 4 5.3 8.7 11.7 13.3 18.7 23.0 Narrative: In the case of the Thomson experiment. The only comment you will need to make is that the change in voltage also led to a change in the magnetic field strength (B); indicate up or down depending on how you changed the voltage. The Rutherford narrative should show a pattern of scintillations that varies with the changes you make in the experimental (independent) variable. Just note those changes. In my case you can see that as the numbers of nucleons (protons and neutrons) increased from 20 to 90, so too did the numbers of mean scintillations increase from 4 to 23. Discussion: Restatement of the purposes: restate the original testable questions. This should be followed by, in the case of Thomson, the calculations leading to the charge to mass ratio of the electron based upon your two data sets 𝐸𝑒 = 𝑉 = 2140 𝑉/𝑚 𝑑 → 𝐸𝑒 = 𝑣𝐵 → 2140 = 𝑣 𝑥 1.65 𝑥 10−4 𝑇 → 𝑣 = 1.29 𝑥 107 𝑚/𝑠 𝑞𝐸𝑒 = 𝑞𝑣𝐵 𝑞 𝑚 = 𝑣 𝐵𝑅 → 𝑞 𝑚 1.29 𝑥 107 = (1.65 𝑥 10−4 )(.457) → 𝑞 𝑚 = 1.71 𝑥10 11𝐶/𝑘𝑔 In the case of the Rutherford experiment, you need to graph the relationship between atomic mass and whatever experimental variable you chose to explore. In my case, I used alpha particle ‘hits’ against a window just of the right of the ray gun. And now the final wrap-up. These results confirm that there is a linear relationship between atomic mass and the degree to which alpha particles are deflected by the nucleus. The differences in the slopes between the Rutherford data and the values collected using the simulation notwithstanding (m = .3754 and .1491, respectively), both regressions predict similar atomic masses with respect to numbers of simulations.
