It should be noted that for the formate saturation coverage limit
advertisement
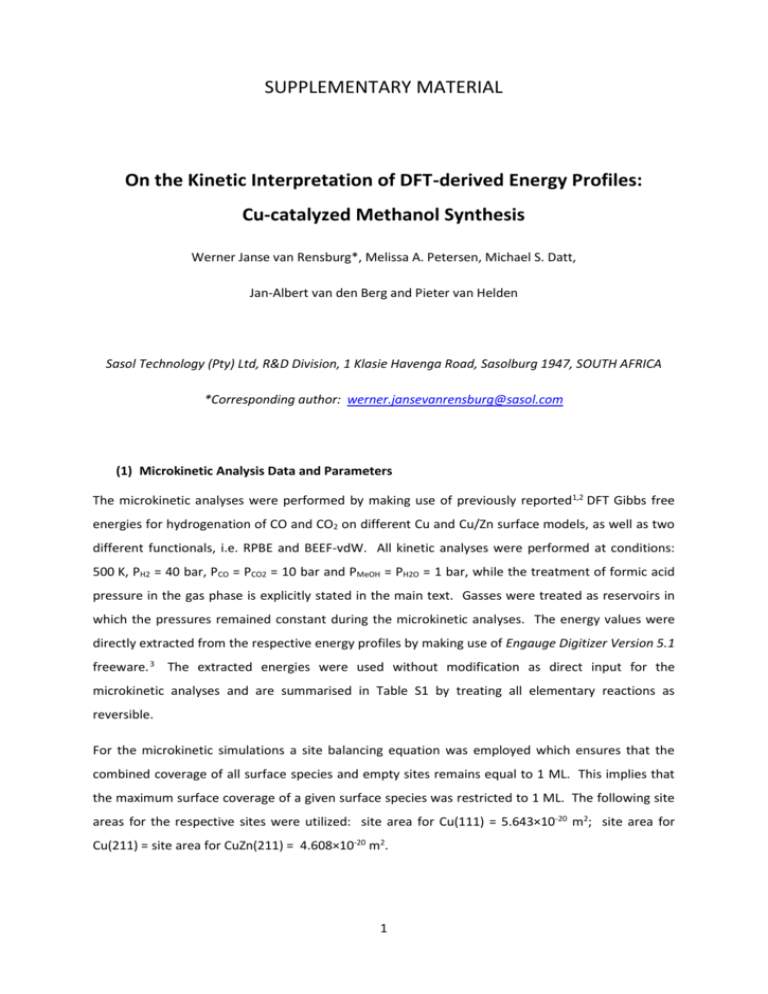
SUPPLEMENTARY MATERIAL On the Kinetic Interpretation of DFT-derived Energy Profiles: Cu-catalyzed Methanol Synthesis Werner Janse van Rensburg*, Melissa A. Petersen, Michael S. Datt, Jan-Albert van den Berg and Pieter van Helden Sasol Technology (Pty) Ltd, R&D Division, 1 Klasie Havenga Road, Sasolburg 1947, SOUTH AFRICA *Corresponding author: werner.jansevanrensburg@sasol.com (1) Microkinetic Analysis Data and Parameters The microkinetic analyses were performed by making use of previously reported1,2 DFT Gibbs free energies for hydrogenation of CO and CO2 on different Cu and Cu/Zn surface models, as well as two different functionals, i.e. RPBE and BEEF-vdW. All kinetic analyses were performed at conditions: 500 K, PH2 = 40 bar, PCO = PCO2 = 10 bar and PMeOH = PH2O = 1 bar, while the treatment of formic acid pressure in the gas phase is explicitly stated in the main text. Gasses were treated as reservoirs in which the pressures remained constant during the microkinetic analyses. The energy values were directly extracted from the respective energy profiles by making use of Engauge Digitizer Version 5.1 freeware. 3 The extracted energies were used without modification as direct input for the microkinetic analyses and are summarised in Table S1 by treating all elementary reactions as reversible. For the microkinetic simulations a site balancing equation was employed which ensures that the combined coverage of all surface species and empty sites remains equal to 1 ML. This implies that the maximum surface coverage of a given surface species was restricted to 1 ML. The following site areas for the respective sites were utilized: site area for Cu(111) = 5.643×10⁻²⁰ m2; site area for Cu(211) = site area for CuZn(211) = 4.608×10⁻²⁰ m2. 1 Table S1. Table of extracted1,2 non-standard Gibbs free energies (500 K, PH2 = 40 bar, PCO = PCO2 = 10 bar and PMeOH = PH2O = 1 bar) used as input for microkinetic analyses. Species G (eV)1 RPBE Cu(111) G (eV)1 RPBE Cu(211) G (eV)1 RPBE CuZn(211) G (eV)2 RPBE Cu(211) G (eV)2 BEEF-vdW Cu(211) 0.00 0.33 0.63 1.46 1.20 1.51 1.96 0.70 1.00 1.67 0.55 0.85 1.64 0.25 0.00 0.09 0.23 1.06 0.81 0.95 1.52 0.66 0.80 1.24 0.30 0.44 1.56 0.25 0.00 0.09 0.23 1.06 0.54 0.67 1.49 0.63 0.77 1.12 0.16 0.30 1.24 0.25 0.00 0.10 0.20 1.02 0.78 0.89 1.46 0.62 0.71 1.07 0.21 0.30 0.89 0.43 0.00 0.12 0.24 1.06 0.82 0.93 1.53 0.60 0.72 1.09 0.13 0.25 0.83 0.25 CO Hydrogenation: CO(g) + 2H2(g) CO* CO* + H* TS HCO* HCO* + H* TS H2CO* H2CO* + H* TS H3CO* H3CO* + H* TS H3COH(g) CO2 Hydrogenation: CO2(g) + 3H2(g) H* TS HCOO* HCOO* + H* TS HCOOH# HCOOH# + H* TS H2COOH* TS H2CO* + OH* H2CO* + OH* + H* TS H3CO* + OH* H3CO* + OH* + H* TS H3COH(g) + OH* H3COH(g) + OH* + H* TS H3COH(g) + H2O(g) * Represents adsorbed states. 0.00 0.00 0.00 0.00 0.00 0.30 0.14 0.14 0.10 0.11 1.33 1.03 1.03 1.01 0.97 0.57 0.06 -0.03 0.06 -0.06 0.87 0.20 0.11 0.16 0.04 1.64 1.46 1.40 1.21 1.25 0.61 0.60 0.59 0.56 0.19 0.91 0.74 0.73 0.67 0.30 2.23 1.88 1.90 1.84 1.56 1.38 1.09 0.96 1.04 0.84 2.19 1.64 1.36 1.59 1.18 1.67 1.40 1.13 1.36 0.97 1.97 1.53 1.26 1.46 1.07 2.63 1.97 1.67 1.90 1.48 1.51 1.04 0.65 0.97 0.51 1.81 1.18 0.79 1.07 0.61 2.61 2.30 1.77 1.64 1.20 0.71 0.49 0.24 0.33 0.13 1.01 0.63 0.38 0.44 0.25 1.92 1.77 1.52 1.08 1.03 0.13 0.13 0.13 0.29 0.18 # Denotes HCOOH(g) for Ref 1 and HCOOH* for Ref 2. 2 (2) Formate Saturation Coverage Limit Procedure Although a number of different methodologies may be followed to implement saturation coverage control during a microkinetic simulation (e.g. saturation coverage control by modifying the energies4 of species on the surface or defining different surface site definitions for different species), all methods will be associated with some limitations. Modification of energies of species for saturation coverage control requires the availability of appropriate energy data for lateral interactions to construct coverage dependent rate constants. Unfortunately this energy data is not available from the sourced data on which the analyses in the current paper are based. An alternative method involving surface site definition protocols for constraining excessive coverages of species was followed in the current study as explained below. A simple dual empty site definition procedure was followed by defining two different empty site descriptions, termed as A-* and B-*, for a given surface model. Total initial empty site concentrations were defined as [A-*] + [B-*] = 1 ML, which represents a clean surface starting state for the simulations. At the beginning of a simulation the concentration of A-* was specified from which the initial concentration of B-* was directly determined according to [B-*] = 1 [A-*]. In order to control the total saturation coverage limit of formate, defined as the saturation coverage limit of [HCOO*] + [HCOOH*], the formation of both HCOO* and HCOOH* was only allowed to take place on the B-* empty site. Consequently, the total [HCOO*] + [HCOOH*] saturation coverage limit was equivalent to initial [B-*] under the assumption that the B-* sites can be fully occupied by HCOO* and HCOOH*. All other species were only allowed to form on the A-* empty site. Although this necessarily restricts the saturation coverage limit of all other species to initial [A-*], this approach for formate saturation coverage limit control is deemed reasonable due to the known dominance of formate steady state coverage, simulated to be in the order 0.86 0.99 ML during conventional steady state simulation runs (see Table 3 in the main text). In order to further illustrate this, Table S2 lists the typical reaction sequences that were employed for CO2 hydrogenation for all formate saturation coverage simulations (to be compared with the conventional reaction sequence associated with a mono empty site definition procedure as listed in Table 1 in the main text): Table S2. Reaction sequences followed for CO2 hydrogenation during formate saturation coverage microkinetic analyses. All elementary reactions are treated as reversible. H2(g) + 2 A-* 2 A-H* CO2(g) + A-H* + B-* A-* + B-HCOO* B-HCOO* +A-H* A-* + B-HCOOH* B-HCOOH* + A-H* A-H2COOH* + B-* A-H2COOH* + A-* A-H2CO* + A-OH* A-H2CO* + A-H* A-H3CO* + A-* A-H3CO* + A-H* H3COH(g) + 2 A-* A-OH* + A-H* H2O(g) + 2 A-* (2) (7) (8) (9) (10) (5) (6) (11) 3 It should be noted that for the formate saturation coverage limit simulations only the sites occupied in the reaction sequences were adjusted, while the energy values associated with each species were not changed. One of the limitations of the current method is the accuracy of kinetic data obtained at the lowest and highest formate saturation coverage limits specified in the simulations. For example, a specified formate saturation coverage limit of 0.0 ML necessarily implies that no empty B-* sites are available on the particular surface, in turn making the formation of HCOO* and HCOOH* not possible according to Table S2. Similarly, a specified formate saturation coverage larger than its steady state coverage determined from a conventional microkinetic simulation results in an artificial underestimation of the A-* empty sites, and consequently the availability of sites for surface species other than HCOO* and HCOOH* on the particular surface. Therefore, the formate saturation coverage limits considered in the current study were 0.1 to 0.8 ML for the RPBE data (conventional steady state formate coverage is 0.86 ML for combined CO + CO2 hydrogenation in Table 3 in the main text) and 0.1 to 0.9 ML for the BEEF-vdW data (conventional steady state formate coverage is 0.97 ML for combined CO + CO2 hydrogenation in Table 3 in the main text). 1. 2. 3. 4. Behrens M, Studt F, Kasatkin I, Kühl S, Hävecker M, Abild-Pedersen F, Zander S, Girgsdies F, Kurr P, Kniep B-L, Tovar M, Fischer RW, Nørskov JK, Schlögl R (2012) Science 336:893. Studt F, Abild-Pedersen F, Varley JB, Nørskov JK (2013) Catal. Lett. 143:71. Engauge Digitizer Version 5.1 is available at: digitizer.sourceforge.net Van Helden P, van den Berg J-A, Weststrate CJ (2012) ACS Catal. 2:1097. 4
