xap-XAP-2013-1173-SupplementaryMaterial_revised
advertisement
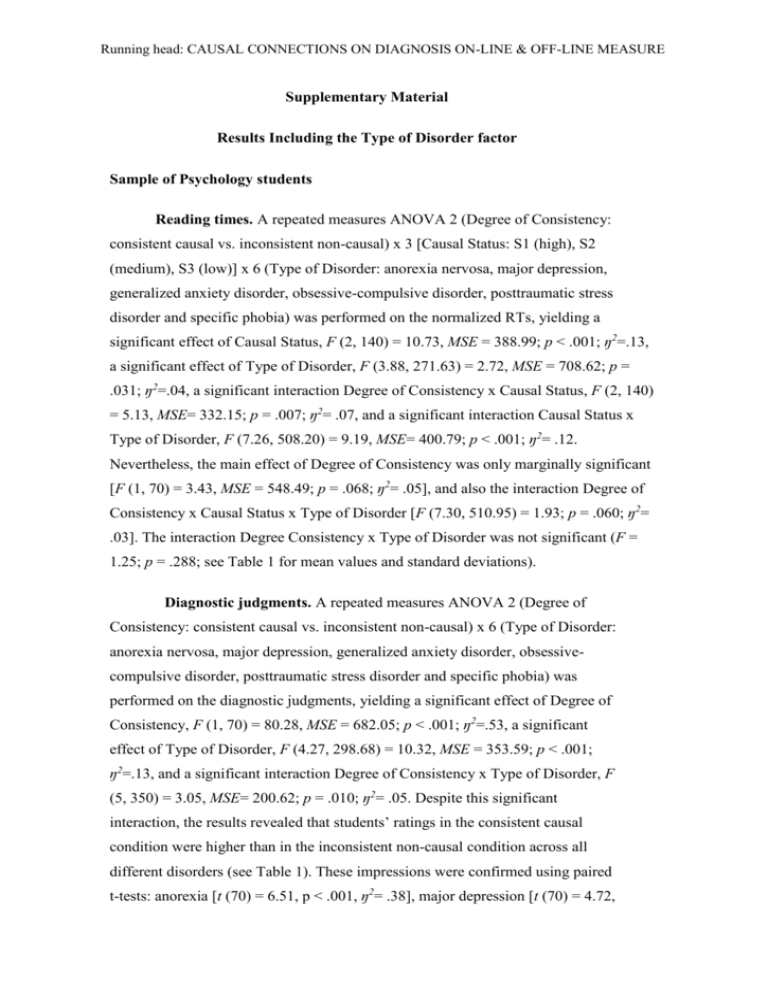
Running head: CAUSAL CONNECTIONS ON DIAGNOSIS ON-LINE & OFF-LINE MEASURE Supplementary Material Results Including the Type of Disorder factor Sample of Psychology students Reading times. A repeated measures ANOVA 2 (Degree of Consistency: consistent causal vs. inconsistent non-causal) x 3 [Causal Status: S1 (high), S2 (medium), S3 (low)] x 6 (Type of Disorder: anorexia nervosa, major depression, generalized anxiety disorder, obsessive-compulsive disorder, posttraumatic stress disorder and specific phobia) was performed on the normalized RTs, yielding a significant effect of Causal Status, F (2, 140) = 10.73, MSE = 388.99; p < .001; ŋ2=.13, a significant effect of Type of Disorder, F (3.88, 271.63) = 2.72, MSE = 708.62; p = .031; ŋ2=.04, a significant interaction Degree of Consistency x Causal Status, F (2, 140) = 5.13, MSE= 332.15; p = .007; ŋ2= .07, and a significant interaction Causal Status x Type of Disorder, F (7.26, 508.20) = 9.19, MSE= 400.79; p < .001; ŋ2= .12. Nevertheless, the main effect of Degree of Consistency was only marginally significant [F (1, 70) = 3.43, MSE = 548.49; p = .068; ŋ2= .05], and also the interaction Degree of Consistency x Causal Status x Type of Disorder [F (7.30, 510.95) = 1.93; p = .060; ŋ2= .03]. The interaction Degree Consistency x Type of Disorder was not significant (F = 1.25; p = .288; see Table 1 for mean values and standard deviations). Diagnostic judgments. A repeated measures ANOVA 2 (Degree of Consistency: consistent causal vs. inconsistent non-causal) x 6 (Type of Disorder: anorexia nervosa, major depression, generalized anxiety disorder, obsessivecompulsive disorder, posttraumatic stress disorder and specific phobia) was performed on the diagnostic judgments, yielding a significant effect of Degree of Consistency, F (1, 70) = 80.28, MSE = 682.05; p < .001; ŋ2=.53, a significant effect of Type of Disorder, F (4.27, 298.68) = 10.32, MSE = 353.59; p < .001; ŋ2=.13, and a significant interaction Degree of Consistency x Type of Disorder, F (5, 350) = 3.05, MSE= 200.62; p = .010; ŋ2= .05. Despite this significant interaction, the results revealed that students’ ratings in the consistent causal condition were higher than in the inconsistent non-causal condition across all different disorders (see Table 1). These impressions were confirmed using paired t-tests: anorexia [t (70) = 6.51, p < .001, ŋ2= .38], major depression [t (70) = 4.72, Running head: CAUSAL CONNECTIONS ON DIAGNOSIS ON-LINE & OFF-LINE MEASURE p < .001, ŋ2= .24], generalized anxiety disorder [t (70) = 6.91, p < .001, ŋ2= .41], obsessive-compulsive disorder [t (70) = 5.83, p < .001, ŋ2= .33], posttraumatic stress disorder [t (70) = 3.55, p = .001, ŋ2= .15], and specific phobia [t (70) = 6.55, p < .001, ŋ2= .38]. Sample of clinicians Reading times. A repeated measures ANOVA 2 (Degree of Consistency: consistent causal vs. inconsistent non-causal) x 3 [Causal Status: S1 (high), S2 (medium), S3 (low)] x 6 (Type of Disorder: anorexia nervosa, major depression, generalized anxiety disorder, obsessive-compulsive disorder, posttraumatic stress disorder and specific phobia) was performed on the normalized RTs, yielding a significant effect of Degree of Consistency, F (1, 29) = 5.41, MSE = 1499.07; p = .027; ŋ2= .16 and a significant effect of Type of Disorder, F (3.09, 89.52) = 3.42, MSE = 2190.54; p = .020; ŋ2=.11. The interaction Causal Status x Type of Disorder was only marginally significant [F (4.87, 141.30) = 2.07, MSE= 1873.58; p = .075; ŋ2= .07], and also the interaction Degree of Consistency x Causal Status x Type of Disorder [F (4.75, 187.52) = 2.11; p = .071; ŋ2= .07]. The main effect of Causal Status (F = .768; p = .469), the interaction Degree of Consistency x Causal Status (F = .646; p = .528) and the interaction Degree of Consistency x Disorder (F = .735; p = .598) were not significant (see Table 1). Diagnostic judgments. A repeated measures ANOVA 2 (Degree of Consistency: consistent causal vs. inconsistent non-causal) x 6 (Type of Disorder: anorexia nervosa, major depression, generalized anxiety disorder, obsessivecompulsive disorder, posttraumatic stress disorder and specific phobia) was performed on the diagnostic judgments, yielding a significant effect of Degree of Consistency, F (1, 29) = 18.24, MSE = 507.34; p < .001; ŋ2=.39 and a significant effect of Type of Disorder, F (5, 145) = 7.05, MSE = 380.72; p < .001; ŋ2=.20. The interaction Degree of Consistency x Type of Disorder was only marginally significant [F (3.25, 94.14) = 2.22, MSE = 482.17; p = .086; ŋ2=.07; see Table 1]. Running head: CAUSAL CONNECTIONS ON DIAGNOSIS ON-LINE & OFF-LINE MEASURE Table 1. Means and standard deviations of RTs for the target sentences (in milliseconds, normalized per letter) across the different Causal Status conditions across disorders; and means and standard deviations of the diagnostic judgments (in a 0 to 100 rating scale) across disorders, in the sample of students and in the sample of clinicians. Students Consistent causal condition S1 (High) S2 (Medium) Inconsistent non-causal condition S3 (Low) S1 (High) S2 (Medium) S3 (Low) M SD M SD M SD M SD M SD M SD Anorexia 38.94 22.11 46.78 25.32 43.36 23.20 47.45 35.33 55.29 28.19 47.70 18.62 Depression 44.64 24.52 52.62 29.54 40.83 21.16 39.50 20.08 52.06 42.26 38.23 17.71 Reading Anxiety 46.56 25.44 40.05 19.26 40.53 23.86 43.95 20.17 42.89 19.32 50.00 30.78 Times Obss-Comp 43.37 20.14 43.00 23.69 50.24 25.35 36.51 19.61 44.87 24.76 55.49 42.85 Stress-Post 40.61 18.64 45.12 25.21 38.42 20.19 39.47 15.91 48.61 27.24 49.32 25.00 Phobia 41.10 17.53 40.71 16.36 44.30 31.00 39.44 23.47 41.01 20.35 40.26 20.57 M SD M SD Anorexia 81.13 15.57 61.55 24.18 Depression 69.08 19.00 56.97 18.18 Diagnostic Anxiety 76.90 15.29 58.03 20.20 Judgments Obss-Comp 73.80 17.96 57.54 21.25 Stress Post 78.17 13.45 68.31 24.08 Phobia 70.92 20.34 51.41 23.39 Clinicians Consistent causal condition S1 (High) S2 (Medium) Inconsistent non-causal condition S3 (Low) S1 (High) S2 (Medium) S3 (Low) M SD M SD M SD M SD M SD M SD Anorexia 53.69 33.70 66.48 36.62 66.86 32.17 83.02 88.64 85.76 85.73 60.35 26.43 Depression 53.28 24.04 61.33 26.59 47.56 21.09 55.67 24.13 59.39 25.02 53.20 28.06 Reading Anxiety 58.60 21.01 53.60 26.57 52.81 26.45 63.20 73.54 50.02 23.17 59.51 27.76 Times Obss-Comp 59.98 28.47 58.19 32.39 54.92 26.75 51.73 24.40 62.41 25.90 65.71 30.37 Stress Post 47.00 20.30 67.64 49.75 60.60 38.32 54.24 28.89 56.83 20.67 71.78 34.18 Phobia 55.58 26.88 51.39 25.36 54.46 32.84 69.51 52.71 63.14 39.90 57.11 25.63 M SD M SD Anorexia 76.50 17.96 63.33 25.37 Depression 55.33 23.30 53.67 20.68 Diagnostic Anxiety 69.33 18.83 63.00 20.66 Judgments Obss-Comp 78.17 15.56 66.33 18.29 Stress Post 72.83 26.61 66.17 20.07 Phobia 71.50 20.14 50.33 24.91
