S1 Table - Figshare
advertisement
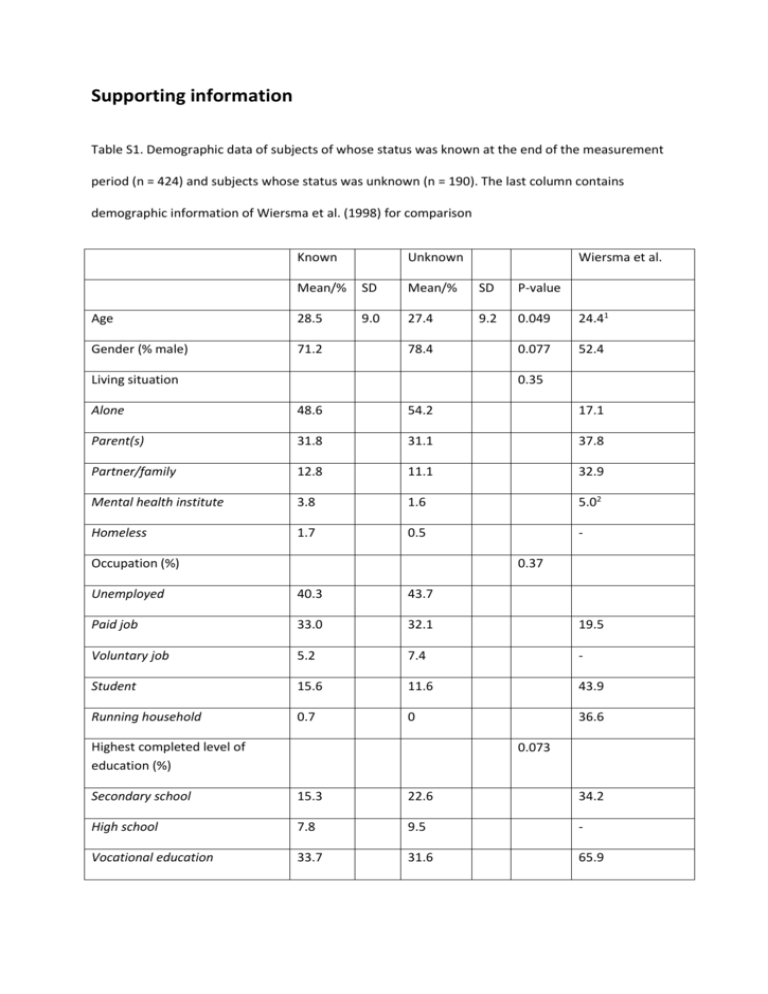
Supporting information Table S1. Demographic data of subjects of whose status was known at the end of the measurement period (n = 424) and subjects whose status was unknown (n = 190). The last column contains demographic information of Wiersma et al. (1998) for comparison Known Unknown Wiersma et al. Mean/% SD Mean/% SD P-value Age 28.5 9.0 27.4 9.2 0.049 24.41 Gender (% male) 71.2 0.077 52.4 78.4 Living situation 0.35 Alone 48.6 54.2 17.1 Parent(s) 31.8 31.1 37.8 Partner/family 12.8 11.1 32.9 Mental health institute 3.8 1.6 5.02 Homeless 1.7 0.5 - Occupation (%) 0.37 Unemployed 40.3 43.7 Paid job 33.0 32.1 19.5 Voluntary job 5.2 7.4 - Student 15.6 11.6 43.9 Running household 0.7 0 36.6 Highest completed level of education (%) 0.073 Secondary school 15.3 22.6 34.2 High school 7.8 9.5 - Vocational education 33.7 31.6 65.9 College 39.2 IQ 96.7 31.1 18.0 96.6 18.8 0.83 Diagnosis (%) - 0.11 Schizophrenia 45.3 36.3 46.0 Substance induced psychosis 4.5 4.2 - Psychotic disorder 19.1 23.2 3.2 Schizoaffective disorder 5.7 2.6 - Delusional disorder 3.5 3.2 - Bipolar disorder 4.2 7.4 7.9 Affective disorders 5.9 5.8 - Other diagnosis 3.1 6.8 42,93 Positive symptoms 7.7 3.7 6.7 3.9 <0.0005 Negative symptoms 12.8 5.7 12.7 6.2 0.65 Disorganized symptoms 5.5 2.7 5.7 3.1 0.52 Excited symptoms 5.3 2.1 5.5 2.7 0.81 Depressive symptoms 7.5 3.1 7.5 3.0 0.56 Antipsychotics (%) 0.24 Medication naïve 17.9 23.7 Oral monotherapy 71.7 66.3 Polypharmacy/depot 8.7 7.9 Haloperidol equivalents4 6.3 3.9 6.2 3.9 0.80 1 Average estimate based on age categories 2 Higher inpatient care reflects care in that period 3 No detailed information on diagnosis 4 Based on Andreasen NC, Pressler M, Nopoulos P, Miller D, Ho BC. (2010) Antipsychotic dose equivalents and dose-years: A standardized method for comparing exposure to different drugs. Biol Psychiatry 67: 255-262. s
