Severity Terminology & Definitions for Speech Pathologists
advertisement
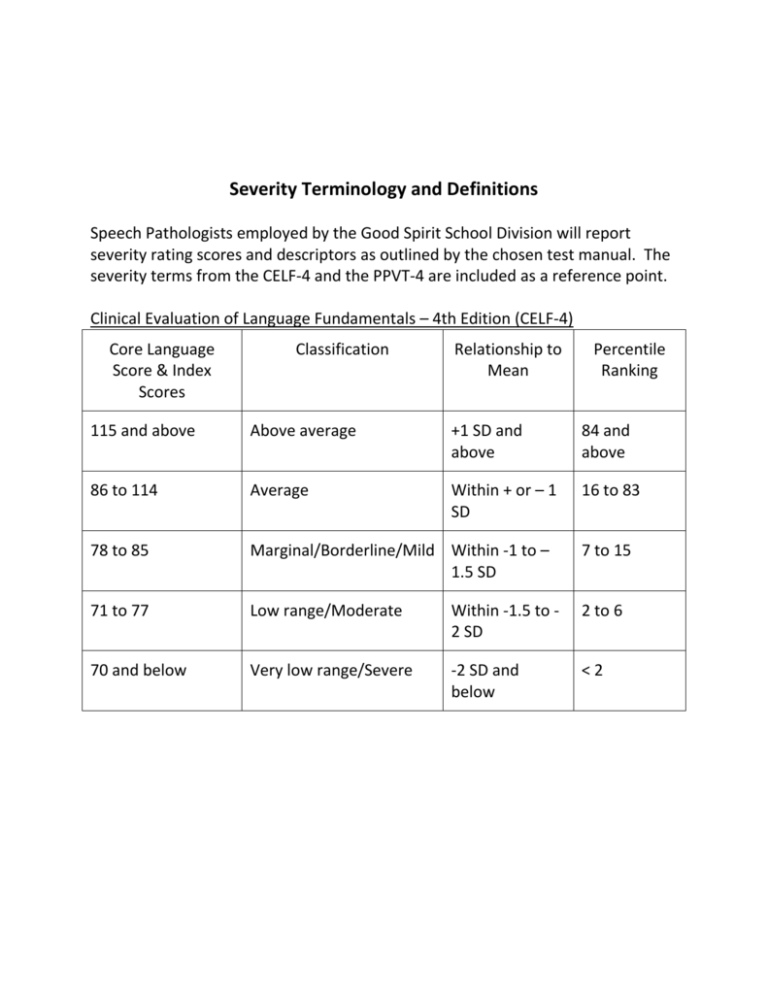
Severity Terminology and Definitions Speech Pathologists employed by the Good Spirit School Division will report severity rating scores and descriptors as outlined by the chosen test manual. The severity terms from the CELF-4 and the PPVT-4 are included as a reference point. Clinical Evaluation of Language Fundamentals – 4th Edition (CELF-4) Core Language Score & Index Scores Classification Relationship to Mean Percentile Ranking 115 and above Above average +1 SD and above 84 and above 86 to 114 Average Within + or – 1 SD 16 to 83 78 to 85 Marginal/Borderline/Mild Within -1 to – 1.5 SD 7 to 15 71 to 77 Low range/Moderate Within -1.5 to 2 SD 2 to 6 70 and below Very low range/Severe -2 SD and below <2 Peabody Picture Vocabulary Test – 4th Edition (PPVT-4) Standard Score Classification Relationship to Mean Percentile Ranking 130 and above Extremely high score +2 SD and above 98 and above 115 to 129 Moderately high score + 1 to +2 SD 84 to 97 100 to 114 High average Avg. To +1 SD 50 to 83 85 to 99 Low average -1 SD to Avg. 16 to 49 70 to 84 Moderate low score -2 SD to -1SD 2 to 15 69 and below Extremely low score -2 SD and below <2 From the parent report in the PPVT (definitions): A standard score shows how your child’s raw score differs from the average by converting the raw score to a score on a new scale. A standard score of 100 is average for a student’s age or grade. Standard scores higher than 100 are above average, and those lower than 100 are below average. For example, if your child’s standard score is 110, this indicates a high average performance on the test. If the score is 89, that indicates a low average performance. A percentile indicates the percentage of students in the group tested who performed at or below your child’s score. For example, if your child’s percentile is 64, this means that he or she performed as well or better than 64% of the children of the same age or in the same grade. (p. 198) In absence of Descriptors provided in the chosen test, the following terminology will be used: Standard Scores and Educational Performance Ranges Above Educational Average → Standard score 115 and above (+1 SD above the mean) Average Educational Range → Standard score 86 to 114 (within +/-1 SD of the mean) Marginal Educational Range → Standard score 79 to 85 (within -1 to -1.5 SD of the mean) Low Educational Range → Standard score 71 to 78 (within -1.5 to -2 SD of the mean) Very Low Educational Range → Standard score 70 and below (-2 SD below the mean)
