4.03 Ecosystems: Activity and Lab Report
advertisement
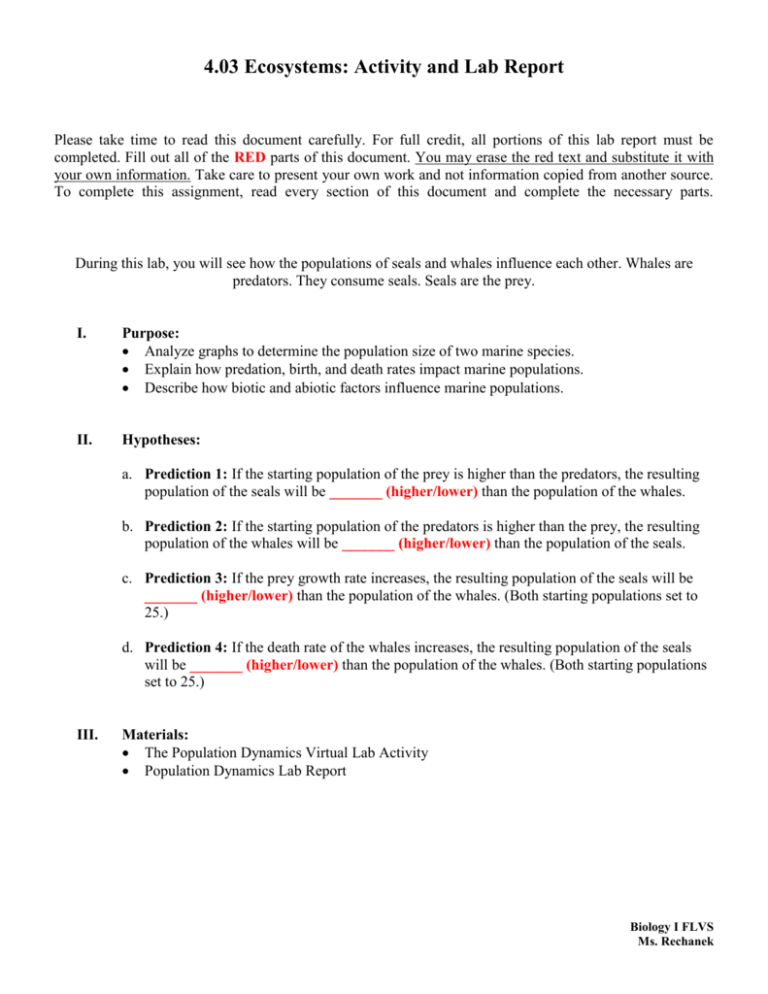
4.03 Ecosystems: Activity and Lab Report Please take time to read this document carefully. For full credit, all portions of this lab report must be completed. Fill out all of the RED parts of this document. You may erase the red text and substitute it with your own information. Take care to present your own work and not information copied from another source. To complete this assignment, read every section of this document and complete the necessary parts. During this lab, you will see how the populations of seals and whales influence each other. Whales are predators. They consume seals. Seals are the prey. I. Purpose: Analyze graphs to determine the population size of two marine species. Explain how predation, birth, and death rates impact marine populations. Describe how biotic and abiotic factors influence marine populations. II. Hypotheses: a. Prediction 1: If the starting population of the prey is higher than the predators, the resulting population of the seals will be _______ (higher/lower) than the population of the whales. b. Prediction 2: If the starting population of the predators is higher than the prey, the resulting population of the whales will be _______ (higher/lower) than the population of the seals. c. Prediction 3: If the prey growth rate increases, the resulting population of the seals will be _______ (higher/lower) than the population of the whales. (Both starting populations set to 25.) d. Prediction 4: If the death rate of the whales increases, the resulting population of the seals will be _______ (higher/lower) than the population of the whales. (Both starting populations set to 25.) III. Materials: The Population Dynamics Virtual Lab Activity Population Dynamics Lab Report Biology I FLVS Ms. Rechanek IV. Procedure and Data: (Complete All of the following 6 Steps) Step 1: Observe the following 3 graphs (graphs 1, 2, and 3). What is the highest population achieved by the whales and seals in each graph? You will need to write this information into Table 1. Biology I FLVS Ms. Rechanek Step 2: Fill out the empty parts of Table 1 below using the information you took from Graphs 1, 2, and 3. Table 1: Predation and Carrying Capacity Trial # Starting Seal Population Number Starting Whale Population Number 1 25 25 2 50 25 3 25 Highest Seal Population Number Highest Whale Population Number Biology I FLVS Ms. Rechanek Step 3: Observe the following 2 graphs (graphs 4 and 5). What is the highest population achieved by the whales and seals in each graph? You will need to write this information into Table 2. Biology I FLVS Ms. Rechanek Step 4: Fill out the empty parts of Table 2 below using the information you took from Graphs 4 and 5. Table 2: Growth Rate and Capture Efficiency Trial # Seal Birth Rate Whale Birth Rate 1 0.05 0.005 2 0.09 0.005 Highest Seal Population Number Highest Whale Population Number Step 5: Observe the following 2 graphs (graphs 6 and 7). What is the highest population achieved by the whales and seals in each graph? You will need to write this information into Table 3. Biology I FLVS Ms. Rechanek Step 6: Fill out the empty parts of Table 3 below using the information you took from Graphs 6 and 7. Table 3: Death Rate and Capture Efficiency Trial # Whale Death Rate Whale Capture Efficiency 1 0.05 0.005 2 0.09 0.005 Highest Seal Population Number Highest Whale Population Number Biology I FLVS Ms. Rechanek V. Reflection Questions: Answer the following 6 questions in complete sentences. 1. Using Table 1, which of the three trials produced the highest population for both the whales and the seals? Why do you think this trial had the best outcome for the whale and seal populations? Hint: Think about the initial population size of the prey. Write your answer here. Make sure to answer both questions. . 2. Using Table 2 and 3, explain how the birth rates of the seals and the death rates of the whales affected the population for both whales and seals. Write your answer here. Make sure to answer both parts of the question. 3. Climate change (an abiotic factor) has slowly decreased habitat for the arctic seals. How would this affect the carrying capacities for both the whales and the seals? Tip: Go over the definition of carrying capacity found in the 4.03 lesson Write your answer here. Make sure to answer both parts of the question. 4. If another source of prey were available to the whales, what changes in population size would you expect for the seals and the whales? Hint: Think about how this would affect their carrying capacity. Write your answer here. 5. In this lesson, you learned about two patterns of population growth and decline, the sigmoid and peak phenomena. Does the seal and killer whale relationship represent a sigmoid or peak phenomenon? Please provide supporting details. Tip: Review the definitions of sigmoid and peak phenomena on page 2 of the 4.03 lesson. Write your answer here. Make sure to EXPLAIN your answer. 6. What are the limitations of the population dynamics lab? Is the lab activity a realistic representation of an arctic marine ecosystem? Note: Please provide detailed support for your opinion. Write your answer here. Make sure to answer both questions. Biology I FLVS Ms. Rechanek

