references
advertisement
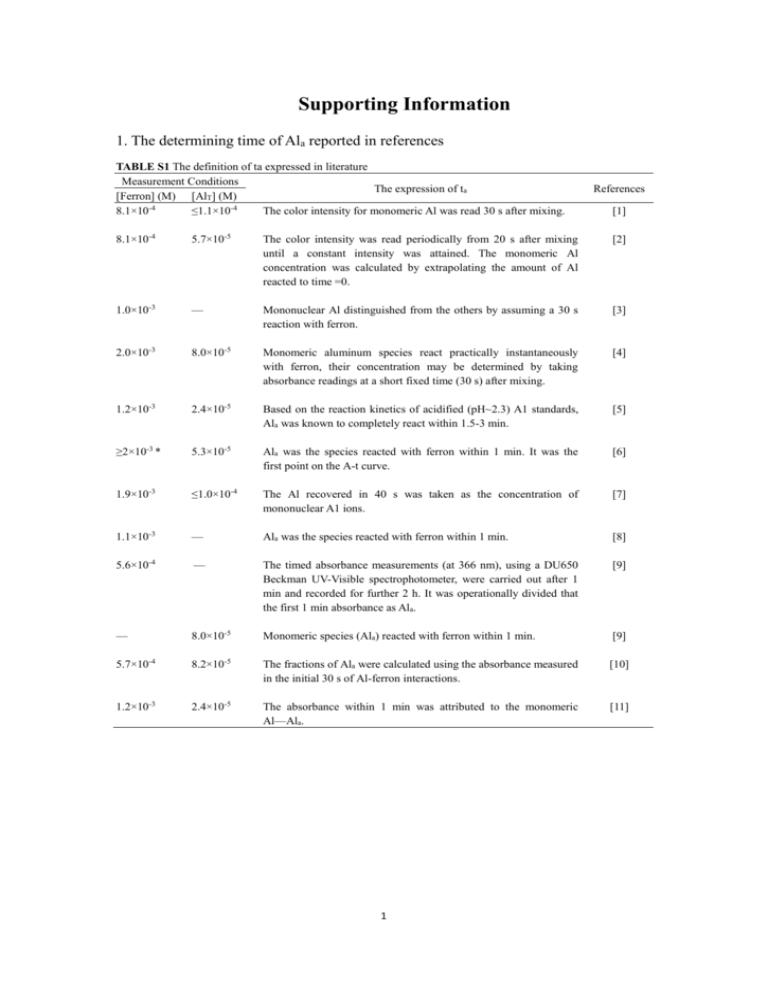
Supporting Information 1. The determining time of Ala reported in references TABLE S1 The definition of ta expressed in literature Measurement Conditions The expression of ta [Ferron] (M) [AlT] (M) 8.1×10⁻⁴ ≤1.1×10⁻⁴ The color intensity for monomeric Al was read 30 s after mixing. References [1] 8.1×10⁻⁴ 5.7×10⁻⁵ The color intensity was read periodically from 20 s after mixing until a constant intensity was attained. The monomeric Al concentration was calculated by extrapolating the amount of Al reacted to time =0. [2] 1.0×10⁻³ — Mononuclear Al distinguished from the others by assuming a 30 s reaction with ferron. [3] 2.0×10⁻³ 8.0×10⁻⁵ Monomeric aluminum species react practically instantaneously with ferron, their concentration may be determined by taking absorbance readings at a short fixed time (30 s) after mixing. [4] 1.2×10⁻³ 2.4×10⁻⁵ Based on the reaction kinetics of acidified (pH~2.3) A1 standards, Ala was known to completely react within 1.5-3 min. [5] ≥2×10-3 * 5.3×10-5 Ala was the species reacted with ferron within 1 min. It was the first point on the A-t curve. [6] 1.9×10⁻³ ≤1.0×10⁻⁴ The Al recovered in 40 s was taken as the concentration of mononuclear A1 ions. [7] 1.1×10⁻³ — Ala was the species reacted with ferron within 1 min. [8] 5.6×10⁻⁴ — The timed absorbance measurements (at 366 nm), using a DU650 Beckman UV-Visible spectrophotometer, were carried out after 1 min and recorded for further 2 h. It was operationally divided that the first 1 min absorbance as Ala. [9] — 8.0×10⁻⁵ Monomeric species (Ala) reacted with ferron within 1 min. [9] 5.7×10⁻⁴ 8.2×10⁻⁵ The fractions of Ala were calculated using the absorbance measured in the initial 30 s of Al-ferron interactions. [10] 1.2×10⁻³ 2.4×10⁻⁵ The absorbance within 1 min was attributed to the monomeric Al—Ala. [11] 1 2. The changing trend of Ala% with ta under different [Ferron] for other [AlT] levels I. [AlT]=2.0×10⁻³ M 100 100 80 80 80 60 Ala% 100 Ala% 120 60 40 40 20 20 20 0 0 60 90 120 150 0 30 60 90 80 Ala% 100 80 Ala% 100 80 Ala% 100 60 60 40 40 20 20 90 120 150 90 120 30 150 80 Ala% 100 80 Ala% 100 80 Ala% 100 60 40 40 20 20 20 0 0 120 150 60 90 120 30 150 100 80 80 Ala% 100 80 Ala% 100 Ala% 120 60 40 40 20 20 20 0 0 150 60 90 120 30 150 120 100 100 100 80 80 80 Ala% Ala% Ala% 120 60 40 40 20 20 20 0 0 90 120 150 60 90 120 30 150 80 Ala% 100 80 Ala% 100 80 Ala% 100 60 40 40 20 20 20 0 0 120 150 60 90 120 30 150 100 80 80 Ala% 100 80 Ala% 100 Ala% 120 60 40 40 20 20 20 0 0 120 150 120 150 120 150 60 40 90 90 ta (s) 120 60 60 ta (s) 120 30 150 0 30 ta (s) 60 120 60 40 90 90 ta (s) 120 60 60 ta (s) 120 30 150 0 30 ta (s) 120 60 120 60 40 60 90 ta (s) 120 30 60 ta (s) 60 150 0 30 ta (s) (e) 120 60 40 120 90 ta (s) 120 90 60 ta (s) 120 60 150 0 30 ta (s) 60 90 60 40 30 60 ta (s) 120 90 120 0 60 120 60 150 20 30 120 30 120 60 ta (s) 60 90 40 0 60 60 ta (s) 120 ta (s) (g) 30 120 30 (f) 150 120 0 (d) 120 ta (s) ta (s) (c) 60 40 30 (b) III. [AlT]=8.0×10⁻³ M 120 Ala% (a) II. [AlT]=4.0×10⁻³ M 120 0 30 60 90 ta (s) ta (s) 120 150 30 60 90 ta (s) FIGURE S1 The changing trend of Ala% with ta under different [Ferron] in the HPAS (a. OH/Al=0; b. OH/Al=0.5; c. OH/Al=1.0; d. OH/Al=1.4; e. OH/Al=1.7; f. OH/Al=2.0; g. OH/Al=2.3. [Ferron]=2.0×10 -4 M (■), 4.0×10⁻⁴ M (○), 8.0×10⁻⁴ M (▲), 1.2×10⁻³ M (▽), 1.6×10⁻³ M (◆), 2.0×10⁻³ M (◁), 2.4×10⁻³ M (★), 3.0×10⁻³ M (□)) 2 3. The changing trend of Ala% with [Ferron] at different ta for the other [AlT] levels [AlT]=4.0×10⁻⁵ M [AlT]=2.0×10⁻⁵ M 120 100 100 100 80 80 80 60 Ala% 120 Ala% Ala% (a) 60 40 40 20 20 20 0 0 0.0 0.5 1.0 1.5 2.0 2.5 3.0 3.5 0 -0.5 0.0 0.5 [Ferron] ( ×10 M) Ala% Ala% Ala% 80 60 60 40 40 20 20 20 0 0 1.0 1.5 2.0 2.5 3.0 3.5 0.0 0.5 1.5 2.0 2.5 3.0 3.5 -0.5 100 80 80 Ala% 100 80 60 40 40 20 20 20 0 0 2.0 2.5 3.0 0.0 0.5 1.0 1.5 2.0 2.5 3.0 -0.5 3.5 80 Ala% 100 80 Ala% 100 80 60 40 40 20 20 20 0 0 2.0 2.5 3.0 3.5 0.0 0.5 1.0 1.5 2.0 2.5 3.0 3.5 -0.5 100 80 80 Ala% 100 80 Ala% 100 60 40 40 20 20 20 0 0 2.0 2.5 3.0 3.5 0.0 0.5 1.0 1.5 2.0 2.5 3.0 3.5 -0.5 100 80 80 Ala% 100 80 Ala% 100 60 40 40 20 20 20 0 0 2.0 2.5 3.0 3.5 0.0 0.5 1.0 1.5 2.0 2.5 3.0 3.5 -0.5 100 80 80 Ala% 100 80 Ala% 100 60 40 40 20 20 20 0 0 1.5 2.0 -3 2.5 3.0 3.5 2.0 2.5 3.0 3.5 1.0 1.5 2.0 2.5 3.0 3.5 0.5 1.0 1.5 2.0 2.5 3.0 3.5 2.5 3.0 3.5 60 40 1.0 1.5 -3 120 [Ferron] ( ×10 M) 1.0 [Ferron] ( ×10 M) 120 0.5 0.0 -3 120 0.0 0.5 [Ferron] ( ×10 M) -3 -0.5 3.5 0 -0.5 [Ferron] ( ×10 M) 60 3.0 60 40 1.5 2.5 -3 120 1.0 2.0 [Ferron] ( ×10 M) 120 0.5 0.0 -3 120 0.0 0.5 [Ferron] ( ×10 M) -3 -0.5 1.5 0 -0.5 [Ferron] ( ×10 M) 60 1.0 60 40 1.5 3.5 -3 120 1.0 3.0 [Ferron] ( ×10 M) 120 0.5 0.0 -3 120 0.0 0.5 [Ferron] ( ×10 M) -3 -0.5 2.5 0 -0.5 [Ferron] ( ×10 M) 60 2.0 60 40 1.5 1.5 -3 100 1.0 1.0 [Ferron] ( ×10 M) 120 0.5 0.0 -3 120 0.0 0.5 [Ferron] ( ×10 M) 120 60 3.5 0 -0.5 3.5 3.0 60 40 1.5 2.5 -3 100 1.0 2.0 [Ferron] ( ×10 M) 120 0.5 0.0 -3 Ala% Ala% Ala% 1.0 [Ferron] ( ×10 M) 120 0.0 1.5 0 -0.5 120 60 1.0 60 40 0.5 0.5 -3 100 0.0 0.0 [Ferron] ( ×10 M) 80 -0.5 Ala% -0.5 100 -3 Ala% 3.5 80 [Ferron] ( ×10 M) Ala% 3.0 100 -0.5 (g) 2.5 120 -3 (f) 2.0 -3 120 [Ferron] ( ×10 M) (e) 1.5 120 -0.5 (d) 1.0 [Ferron] ( ×10 M) -3 (c) 60 40 -0.5 (b) [AlT]=8.0×10⁻⁵ M 120 0 -0.5 0.0 0.5 1.0 1.5 2.0 [Ferron] ( ×10 M) -3 2.5 3.0 3.5 -0.5 0.0 0.5 1.0 1.5 2.0 [Ferron] ( ×10 M) -3 FIGURE S2 The changing trend of Ala% with [Ferron] at different ta (a. OH/Al=0; b. OH/Al=0.5; c. OH/Al=1.0; d. OH/Al=1.4; e. OH/Al=1.7; f. OH/Al=2.0; g. OH/Al=2.3. ta=40 s (■), 60 s (○), 80 s (▲), 100 s (▽), 120 s (★), 140 s (*)) 3 REFERENCES 1. Bersillon, J. L.; Hsu, P. H.; Fiessinger, F. Characterization of hydroxyaluminum solutions. Soil Sci. Soc. Am. J. 1980, 44(3), 630-634. 2. Tsai, P. P.; Hsu, P. H. Studies of aged OH-Al solutions using kinetics of Al-ferron reactions and sulfate precipitation. Soil Sci. Soc. Am. J. 1984, 48(1), 59-65. 3. Jardine, P. M.; Zelazny, L. W. Mononuclear and polynuclear aluminum speciation through differential kinetic reactions with ferron. Soil Sci. Soc. Am. J. 1986, 50(4), 895-900. 4. Changui, C.; Stone, W. E. E.; Vielvoye, L.; Dereppe, J. M. Characterization by nuclear magnetic resonance spectroscopy, ferron assay, and acidification of partially neutralized aluminum solutions. J. Chem. Soc., Dalton Trans. 1990, 1723-1726. 5. Parker, D. R.; Bertsch, P. M. Identification and quantification of the Al13 tridecameric polycation using ferron. Environ. Sci. Technol. 1992, 26(5), 908-914. 6. Feng, L.; Luan, Z. K.; Tang, H. X. Study on speciation analysis methods for hydrolysis polymerization of aluminum. Environ. Chem. (in Chinese) 1993, 12(5), 373-379. 7. Wang, W. Z.; Hsu, P. H. The nature of polynuclear OH-Al complexes in laboratory-hydrolyzed and commercial hydroxyaluminum solutions. Clays Clay Miner. 1994, 42(3), 356-368. 8. Gao, B. Y.; Yue, Q. Y.; Wang, Y.; Yu, H. Study on the aluminum species of PACS by using Al-Ferron timed complex colorimetric method. Environ. Chem. (in 4 Chinese) 1996, 15(3), 234-239. 9. Shi, B. Y.; Tang, H. X. Study of polyaluminum-organic polymer composite flocculants - combination of Al-Ferron and 27Al-NMR methods. Acta Sci. Circum. (in Chinese) 2000, 20(3), 391-396. 10. Wang, D. S.; Sun, W.; Xu, Y.; Tang, H. X.; Gregory, J. Speciation stability of inorganic polymer flocculant-PACl. Colloids Surf., A. 2004, 243(1-3), 1-10. 11. Chen, Z. Y.; Fan, B.; Peng, X. J.; Zhang, Z. G.; Fan, J. H.; Luan, Z. K. Evaluation of Al30 polynuclear species in polyaluminum solutions as coagulant for water treatment. Chemosphere 2006, 64(6), 912-918. 5


