pollution level metropolitan cities
advertisement
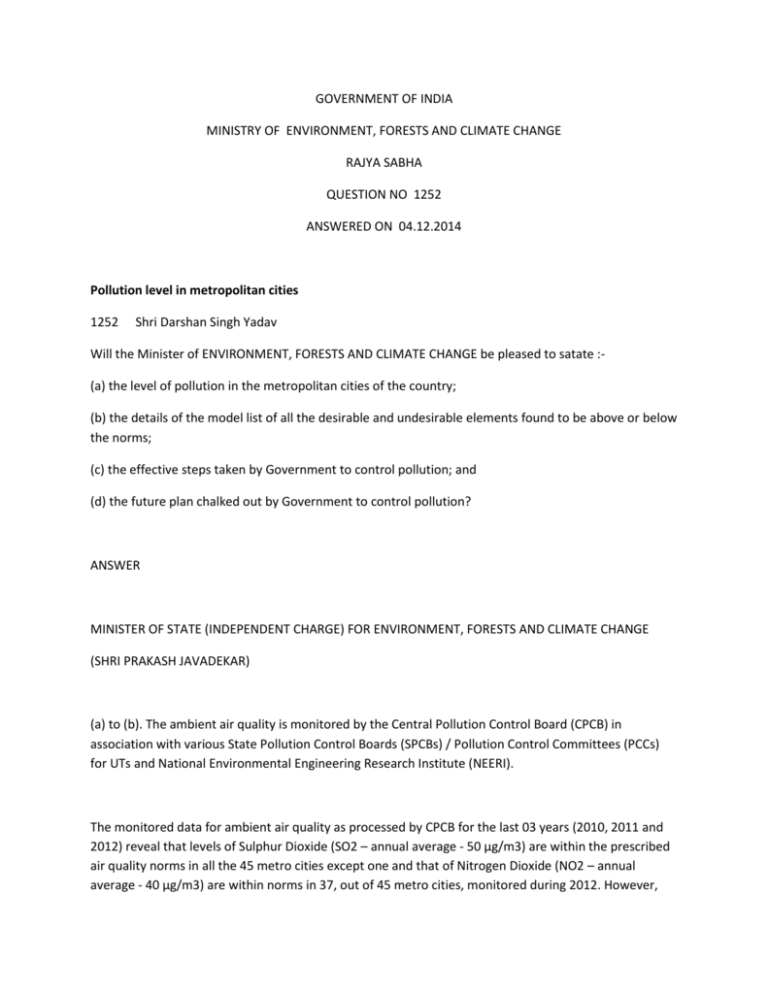
GOVERNMENT OF INDIA MINISTRY OF ENVIRONMENT, FORESTS AND CLIMATE CHANGE RAJYA SABHA QUESTION NO 1252 ANSWERED ON 04.12.2014 Pollution level in metropolitan cities 1252 Shri Darshan Singh Yadav Will the Minister of ENVIRONMENT, FORESTS AND CLIMATE CHANGE be pleased to satate :(a) the level of pollution in the metropolitan cities of the country; (b) the details of the model list of all the desirable and undesirable elements found to be above or below the norms; (c) the effective steps taken by Government to control pollution; and (d) the future plan chalked out by Government to control pollution? ANSWER MINISTER OF STATE (INDEPENDENT CHARGE) FOR ENVIRONMENT, FORESTS AND CLIMATE CHANGE (SHRI PRAKASH JAVADEKAR) (a) to (b). The ambient air quality is monitored by the Central Pollution Control Board (CPCB) in association with various State Pollution Control Boards (SPCBs) / Pollution Control Committees (PCCs) for UTs and National Environmental Engineering Research Institute (NEERI). The monitored data for ambient air quality as processed by CPCB for the last 03 years (2010, 2011 and 2012) reveal that levels of Sulphur Dioxide (SO2 – annual average - 50 µg/m3) are within the prescribed air quality norms in all the 45 metro cities except one and that of Nitrogen Dioxide (NO2 – annual average - 40 µg/m3) are within norms in 37, out of 45 metro cities, monitored during 2012. However, the levels of fine particulate matter (PM10 – annual average - 60 µg/m3) exceeded the prescribed norms in 42 out of 45 metro cities monitored during 2012 (Annexure-I). A fluctuating/mixed trend is being observed in case of NO2, SO2, and PM10 while NO2 is an upcoming pollutant. (c)&(d) The Government has taken various measures to contain air pollution which inter alia include, supply of cleaner fuels as per auto fuel policy, use of gaseous fuel for public transport, pollution under control (PUC) certificate for in use vehicles, stringent source specific emission standards, strict compliance of source specific emission standards, use of beneficiated coal in thermal power plants, strengthening public transport, expansion of metro train system, implementation of revised emission norms for gensets, implementation of city specific action plan in 16 cities, etc. ****** Annexure referred to in reply to paras (a) and (b) of the Rajya Sabha unstarred question no. 1252 to be answered on 04.12.2014, raised by SHRI DARSHAN SINGH YADAV regarding Pollution level in metropolitan cities; Annexure I Air quality status of 46 million plus cities for 2010, 2011, 2012 (Annual average (µg/m3) State 2010 City 2011 2012 SO2 NO2 PM10 SO2 NO2 PM10 SO2 NO2 PM10 Hyderabad (GH) Vishakhapatnam (GVMC) 5 24 79* 5 29 86* 4 28 79* 7 16 71* 6 11 90* 6 12 97* Andhra Pradesh Vijaywada 6 14 93* 13 20 80* 12 13 65* Bihar Patna 7 40 181* 5 47* 174* 6 36 166* Chattisgarh Raipur 15 43* 289* 14 42* 293* 14 40 268* Delhi Delhi (DMC) 5 55* 261* 5 57* 222* 5 59* 237* Ahmedabad 15 21 95* 13 25 79* 12 24 83* Rajkot 13 17 96* 13 18 98* 13 17 99* Surat 16 24 76* 17 26 94* 16 26 97* Gujarat Vadodara 17 29 93* 17 29 88* 16 33 102* Haryana Faridabad 18 29 164* 21 44* 177* 12 38 184* Jammu & Kashmir Shrinagar @ @ @ @ @ @ @ @ @ Jharkhand Dhanbad 15 36 184* 16 35 202* 17 40 178* Karnataka Madhya Pradesh Ranchi 19 35 172* 18 35 170* 18 35 202* Bangalore (BBMP) 14 Bhopal 9 31 89* 16 29 94* 14 28 121* 18 133* Gwalior 3 17 175* 3 21 173* 12 20 308* 12 20 309* 13 27 329* Indore 14 18 120* 12 14 142* 12 20 143* Jabalpur 2 25 135* 2 25 73* 2 24 75* Aurangabad 6 21 75* 9 31 83* 9 32 80* Mumbai 4 19 97* 5 35 119* 5 20 117* Nagpur 7 33 113* 8 34 106* 10 32 103* Nashik 21 26 76* 25 27 101* 24 27 95* Pune 29 39 82* NA NA NA 32 NA 58* NA 113* NA 22 NA 44* NA 93* NA Thane 14 14 50 72* 39 113* 17 43* 120* Kalyan Dombivali NA NA 52* 87* 114* Pimpri Chinchwad NA 56 129* - 12 20 13 44* - 20 Navi Mumbai 16 17 30 49* 139* 22 47* 89* Amritsar 14 36 219* 14 36 210* 15 39 202* Ludhiana 9 32 214* 11 28 221* 11 27 228* Jaipur 6 37 164* 7 42* 147* 9 52* 187* Jodhpur 6 22 181* 5 23 168* 6 24 189* Kota 10 29 132* 7 31 139* 8 32 156* Chennai 9 15 59 12 19 65* 12 21 57 Coimbatore 5 27 78* 4 33 86* 3 27 68* Madurai 11 25 47 11 24 45 14 30 48 Agra 5 20 185* 5 22 165* 5 23 196* Allahabad 4 24 218* 6 23 260* 4 32 317* Ghaziabad 30 37 290* 31 39 231* 30 34 248* Kanpur 7 34 203* 8 33 184* 8 34 215* Lucknow 8 34 204* 8 33 189* 8 32 211* Varanasi 18 20 127* 17 20 127* 18 21 138* Meerut 8 47* 166* 5 45* 122* 4 43* 129* Kolkata 11 62* 99* 13 66* 115* 12 70* 135* Howrah 46 cities 12 75* 5 118* 39 12 62* 11 131* 41 13 40 186* 1 8 42 Vasai-virar Maharashtra Punjab Rajasthan Tamilnadu Uttar Pradesh West Bengal 15 states 1UT Year 2010 2011 2012 No. of million plus cities with operating NAMP stations and exceeding National Standard (NAAQS-2009) No. of million plus cities (46 cities as per Census 2011) Exceeding / violating NAAQS 2009 with operating NAMP stations SO2 NO2 PM10 43 0 5 39 44 0 11 41 44 1 8 42

