Lab1
advertisement
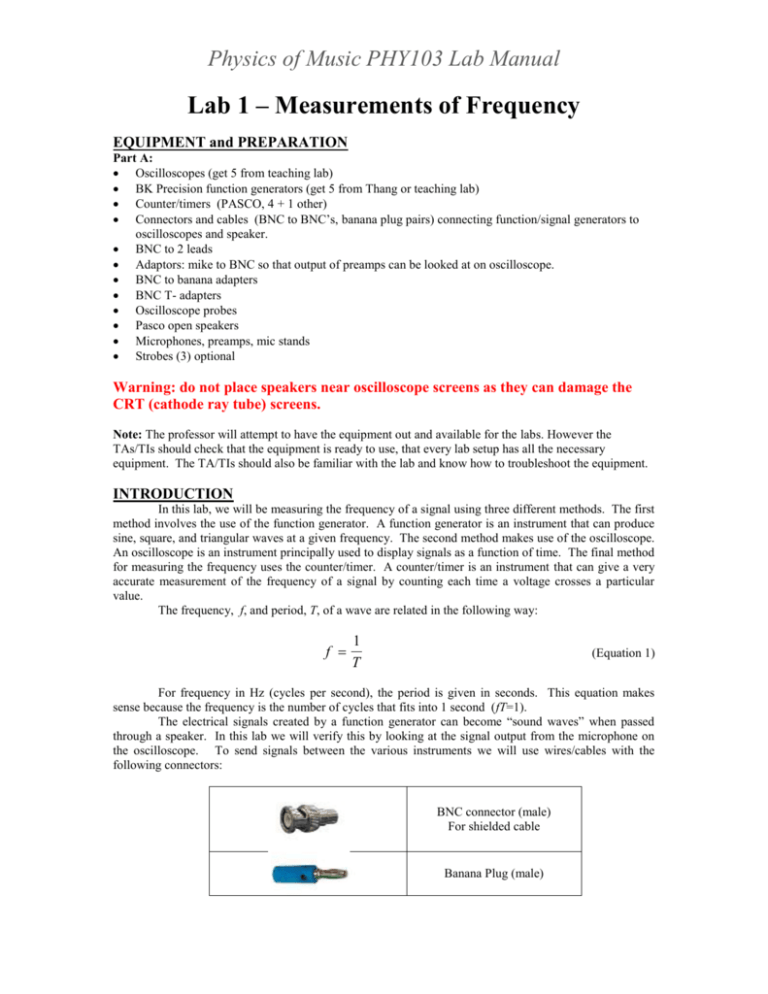
Physics of Music PHY103 Lab Manual Lab 1 – Measurements of Frequency EQUIPMENT and PREPARATION Part A: Oscilloscopes (get 5 from teaching lab) BK Precision function generators (get 5 from Thang or teaching lab) Counter/timers (PASCO, 4 + 1 other) Connectors and cables (BNC to BNC’s, banana plug pairs) connecting function/signal generators to oscilloscopes and speaker. BNC to 2 leads Adaptors: mike to BNC so that output of preamps can be looked at on oscilloscope. BNC to banana adapters BNC T- adapters Oscilloscope probes Pasco open speakers Microphones, preamps, mic stands Strobes (3) optional Warning: do not place speakers near oscilloscope screens as they can damage the CRT (cathode ray tube) screens. Note: The professor will attempt to have the equipment out and available for the labs. However the TAs/TIs should check that the equipment is ready to use, that every lab setup has all the necessary equipment. The TA/TIs should also be familiar with the lab and know how to troubleshoot the equipment. INTRODUCTION In this lab, we will be measuring the frequency of a signal using three different methods. The first method involves the use of the function generator. A function generator is an instrument that can produce sine, square, and triangular waves at a given frequency. The second method makes use of the oscilloscope. An oscilloscope is an instrument principally used to display signals as a function of time. The final method for measuring the frequency uses the counter/timer. A counter/timer is an instrument that can give a very accurate measurement of the frequency of a signal by counting each time a voltage crosses a particular value. The frequency, f, and period, T, of a wave are related in the following way: f 1 T (Equation 1) For frequency in Hz (cycles per second), the period is given in seconds. This equation makes sense because the frequency is the number of cycles that fits into 1 second (fT=1). The electrical signals created by a function generator can become “sound waves” when passed through a speaker. In this lab we will verify this by looking at the signal output from the microphone on the oscilloscope. To send signals between the various instruments we will use wires/cables with the following connectors: BNC connector (male) For shielded cable Banana Plug (male) Physics of Music PHY103 Lab Manual ¼’’ phone (TRS) connector (male) PURPOSE The purpose of this lab is to gain familiarity with varying electronic signals and connect detection of sound waves to the equipment that we use to measure them. We will gain a working knowledge of a function generator, an oscilloscope, and a counter/timer. We will look at signals picked up by an oscilloscope probe and that from a microphone. We will experiment with different ways of measuring frequency. The goal of the lab report is to compare and contrast our different measuring frequency measuring techniques. PROCEDURE Part I – The Function Generator Turn on the function generator. Press in the button on the front panel with the sine wave picture. Where it is labeled “Range,” press the “500” button. Use the “Course” and “Fine” tuning dials (where it is labeled “Frequency” on the front panel) until the display reads 300 Hz. In your notebook, write “300 Hz” for the value you obtained for your frequency using the function generator on your first trial. You will want to record your different measurements! Turn the Output level (amplitude) knob on the function generator so the output is at about half of the maximum (this is so it won’t make a very loud sound in the next step). Connect the output of the function generator to the speaker. Adjust the amplitude. Vary the frequency from the function generator. Make sure you can hear a tone from the speaker. Get a feeling for what frequencies correspond to which sounds. Explore the range of your hearing in frequency. What is the lowest frequency you can hear and the highest you can hear? Change the signal to a square wave or a triangle wave. Notice that they have different sounds. Revert to sine wave, set the frequency back to 300Hz and disconnect the speaker. Please keep the speaker away from the oscilloscope to prevent damage to the CRT screens! Part II – The Oscilloscope (you will be using Tenma scopes) 1. 2. 3. 4. 5. 6. Turn on the oscilloscope by pushing in the power. It will take a few seconds for a trace to appear on the screen. If one does not appear in a few seconds, try increasing the trace intensity (see #3). Connect the output of the function generator to one of the inputs of the oscilloscope. Adjust the intensity. This is done by turning the intensity button on the Tenma scopes in the Display section. There is a FOCUS knob. You can adjust this knob to focus the line in the CRT monitor. Note that if the speaker is near the oscilloscope, its magnet can distort the display. This is kind of fun to show but if you do too much of this it can damage the CRT and permanently warp it (we had this happen one year.) There is a MODE switch in the “Vertical” section. If your signal from the function generator is going into Channel 1 then move this switch to “CH 1.” This allows you to look at channel 1. There are two channels available so that it is possible to compare two traces at once. To show both traces at once (that is the signals going into channel 1 and 2), select the DUAL mode. Ordinarily you look channel 1 or 2 in the y axis vs time in the x axis.. The X-Y mode allows you to look at an x versus y display. The horizontal (x-axis) signal is connected through the CH1 X Physics of Music PHY103 Lab Manual 7. 8. 9. 10. 11. 12. 13. 14. 15. 16. 17. 18. 19. 20. 21. 22. input connector and the vertical (y-axis) signal is connected through the CH2 Y input connector. The ADD mode allows two traces to be added together. If your signal is going into Channel 2 then you would make sure that the MODE switch is either on “CH2” or on “Dual”. There is a SOURCE switch in the “Trigger” section. Make sure this switch is on “CH1.” (if your signal from the function generator is in Channel 1) or on “CH2” (if your signal is going in Channel 2). Using the CH1 Y shift control (the vertical arrows) in the “Vertical” section to make sure that the trace is in the middle of the screen vertically. Using the X shift control (the horizontal arrows) in the “Horizontal” section, make sure that the trace is in the middle of the screen horizontally. Turn the VARIABLE knob, in the “Horizontal” section, clockwise to the CAL position. If this is not done you might measure incorrect times. In the “Vertical” section, there is a GND (ground) button. Make sure that this button is sticking out (i.e. not pushed in). This will keep the signal from being grounded or shorted out. On other Tenma scopes you must select either GND, AC (alternating) or DC (direct current). Make sure GND is NOT selected. If GND is selected you will not be able to see your signal (but you can center the signal and make sure you know where 0Volts is). If the waveform on your screen is not stationary, adjust the LEVEL knob in the “Trigger” section. When the waveform is not stationary it is said to be “free-running”. If your signal is not stationary then the TRIGGER may not be adjusted properly or you make have selected the wrong channel for the trigger. The CH1 dial contains an inner and outer dial. Make sure the inner dial is pushed in and set all the way clockwise to CAL. This way the voltage read from the screen can be converted into Volts. Otherwise the voltage read from the screen in boxes will not correspond to that chosen from the voltage knob in Volts. The TIME/CM or TIME/DIV knob in the “Horizontal” section specifies how long it takes for the trace to sweep through a centimeter box on the oscilloscope screen. Adjust the TIME/CM or TIME/DIV knob so you can see about one or two full cycles on the monitor. The VOLTS/CM or VOLTS/DIV knob in the “Vertical” section determines how tall the signal will be on the screen. Adjust the VOLTS/DIV knob for channel 1 to obtain a waveform that fills almost all of the screen vertically. Re-adjust the INTENSITY and FOCUS knobs to get a clear trace. At this point you should have a stationary waveform positioned nicely on your screen. If this is not the case, ask for some help from the instructor. Count the number of squares in one period of the wave (peak to peak). Record this number in your notes. Remember that each square is 1 cm by 1 cm. Multiply this number by the value that the TIME/CM (or TIME/DIV) knob is set to. Make sure to convert the value that the TIME/CM (or TIME/DIV) knob is set at into seconds per centimeter. For example, 0.2 ms/cm = .0002 s/cm. The number that you have just calculated is the period of the signal in seconds. Record this value in your notes. Determine the frequency of the signal using equation (1). In your lab notebook, write the value you obtained where it asks for the value of your frequency using the oscilloscope on your first trial. Error estimation: Suppose you mis-measure by 1/5 box on the screen. Redo your calculation. Compare this frequency to the one that you calculated in #20. The difference can be an estimate of the error or your uncertainty of your measurement. Record your estimated error (uncertainty) in your notes. Part III – The Counter/Timer 1. 2. Turn on the counter (switch on power supply module on left). A counter toggles every time the signal crosses a certain level. It can be used to count the number of crossings per second. Connect the output of the function generator to the counter input area. The black lead from the generator should go to the GND (ground, black) input. The red lead from the generator should go to the white or 0.5V p/p MIN lead. This stands for 0.5Volts peak to peak. To get the counter to trigger the input must go above 0.5Volts peak to peak. Note: there is one counter that is simpler Physics of Music PHY103 Lab Manual 3. 4. 5. than all the rest and connects with BNC and no leads. If you are at this lab set up the counter should simply show you the frequency in Hz (though I think there is also a reset button). In the counter module flip the black mode switch (up and down switch) to measure frequency (kHz) (bottom position). Note 1kHz is 1000 Hz. In your notebook, record the value you obtain for the frequency measured by the counter. You can make a more accurate measurement by setting the counter module to counter (middle position for the black mode switch). The set the counter to 1s (this is the horizontal switch in the counter section). On the upper right press the START/STOP button. The counter should measure the number of pulses in 1s. To make another measurement, you can press RESET (button on top left) before you start the counter again. You can do this a number of times and compute an average value. Part IV – Additional Measurements 1. Carry out about ten similar trials at different frequencies. For example at 1000 and 5000 Hz or other frequencies that you might choose. Try to choose a range (corresponding to the range of frequencies that you can hear). For these additional trials use the three methods (function generator, counter and oscilloscope) to record or estimate frequencies. In your lab report you will discuss differences between the frequency measurements and your feelings about the uncertainties in these measurements. Part V – Looking at the output of the microphone on the oscilloscope. 1. Connect the output of the pre-amp into an input of the oscilloscope. You will need an adapter (male BNC to female 1/4” audio) that should be part of the equipment on the desk. 2. Make sure that your microphone is connected to the preamp and that the preamp is plugged in. The green power indicator should light up. The +48V button should be pushed in. This powers the microphone that employs a capacitor. The capacitor creates an electric field between two plates. The plates respond to small pressure variations (such as those made by sound waves) creating a signal that is amplified by the preamp and passed on to the computer. Powered microphones are usually superior to un-powered ones. 3. Play a sound from the computer speaker or by connecting the function generator to the open speaker. If you use the function generator you can send that signal into channel 2 of the oscilloscope and display both the signal from the microphone and that from the function generator together. 4. Compare the output of the preamp (fed by the microphone) to the signal from the function generator. You can adjust the strength of the microphone output with the dials on the preamp. This signal should be stronger than that you will see by using the speaker as a microphone in the next lab. 5. Try singing or speaking into the microphone while looking at the signal on the oscilloscope. Can you sing notes that cause the microphone signal to be a periodic signal even with the speaker on? (Pure intervals such as octaves or fifths or thirds?) Part VI – Your body as a conductor and Antenna. 1. 2. 3. 4. 5. Remove the BNC cable from the CH1 input. Plug in the oscilloscope probe into CH 1. Touch the end of the oscilloscope with your finger. Adjust the Ch 1 VOLTS knob so that you can see a signal. While your body is a pretty good antenna, you don’t actually pick up a large voltage. You can use the oscilloscope to look at very small voltages and you will need to do so to see a signal. Adjust the TIME/CM (TIME/DIV) knob to very small time intervals. You should see a lot of high frequency noise. Adjust the TIME/CM (TIME/DIV) knob to larger time intervals. Look for a sine wave pattern in the noise. Your body is picking up a pretty strong low frequency signal. What is this frequency coming from? Measure its frequency to see if the frequency itself gives you a clue. Hint given at the end of the lab. * Physics of Music PHY103 Lab Manual DATA ANALYSIS (Lab Report) 1. 2. 3. 4. 5. 6. 7. 8. Create a data table showing your measured frequencies. Explain where each row of numbers comes from and how you measured or calculated each. Remember to define symbols (and possibly units of quantities) in your table and if you give equations. Refer to the table in your text. For example: “Column 2 of Table 1 lists frequency measurements based on the oscilloscope and calculated with the equation f=1/T and using the procedure described above. Column 3 of Table 1 lists frequencies measured with the counter.” Mention your table in your discussion. Assume your reader is incapable of seeing the numbers in the table without them being pointed out. For example: “Comparison of Column 1 and 3 shows that the counter and frequency generator measured the same frequencies to an accuracy of 1Hz. The difference between Columns 1,2 and 1,3 in Table 1 suggests that the frequency measurements errors from the oscilloscope are the largest.” Look for and mention trends (or lack of them). Are the oscilloscope measurements systematically high or low compared to the settings of the function generator and counter/timer? Are the differences larger than you expect? Estimate the sizes of your errors or uncertainties. The difference between two measured frequencies would be a Δf in Hz. You could also compute Δf/f which would give you the error as a fraction of the signal. It might make sense to discuss errors for the oscilloscope in terms of a fraction or Δf/f and for the counter in terms of Δf or an absolute difference in Hz. Are the errors larger or smaller at high frequencies than low frequencies? In this lab your discussion of data can be used to argue which instruments are most accurate and estimate how accurate they are. These can be considered “results” and so can go into your abstract. For example. “We find that the frequency given on the function generator agreed with that measured by the counter, with differences between the two measurements that were within 24 Hz for signals in the range 100- 1kHz. We infer that these two instruments probably give accurate frequency measurements with errors less than 2-4Hz. We find that frequencies measured on the oscilloscope were consistent with the other measurements but tended to differ from the other measurements by a larger number or ~10Hz. We find that the counter made more reliable measurements of frequency than the oscilloscope. Noise picked up on the oscilloscope probe contained a strong signal with frequency approximately 60Hz and so was likely associated with AC power.” A note on error analysis: Sometimes scientists are under the impression that error analysis must be done in order to achieve a type of professionalism. However error analysis requires work and in order to accomplish more one must figure out where and when it is important to do this work. If experimental errors are not significantly affecting your measurements then it is silly to spend a lot of time analyzing them (your time is too valuable!). Errors are a problem if they are significantly affecting your measurements. For example, in your report you might want to argue that experimental errors are not affecting or invalidating your major findings. As part of this argument you could demonstrate understanding and estimates of the size of the errors. These estimates might then be used to show that the errors wouldn’t significantly change your measurements or invalidate the major results of your experiment. Errors are a part of any experiment. Sometimes your analysis suggests a trend or gives you a measurement that might not be certain. In this case you should discuss the uncertainties in your results and how they might be affecting your measurement or trend. Your conclusion would give a summary of your trend or measurement and then would explain the problems with the measurements. You could also suggest future ways (if any) of improving your experiments to validate (with better data) the results of your study. QUESTIONS and DISCUSSION 1. Did you measure the same frequencies with different measurement techniques? Why or why not? Physics of Music PHY103 Lab Manual 2. 3. 4. 5. 6. If you measured the frequency with both oscilloscope and counter, which method did you find most accurate? How could you tell it was the most accurate? Can the counter measure fractional frequencies? Is it more accurate at low or high frequencies? About how accurately can you measure the frequency with the oscilloscope and counter? (to what % or what difference in Hz?). Is the accuracy of your measurements higher or lower at low frequencies than high frequencies? Discuss trends or lack of them. You may find it easier to illustrate trends by making a figure plotting the measurements from each instrument or by referring to lists of numbers in a data table. Is the difference between the frequency you measure on your body and 60Hz from AC power within your estimated errors? If the difference is less than the error then your measurement is consistent with 60Hz and so the frequency you measure on your body is likely to be ``consistent with’’ 60Hz. If the difference is greater than your estimated error then it is possible you are measuring something else (and so would be ``inconsistent with’’ 60Hz). Is it possible to use the counter to measure the frequency you picked up on the oscilloscope probe? (We used the oscilloscope to look at this signal but found that the counters were pretty accurate --so why didn’t we use the counter to measure that frequency?) MINIMAL REQUIREMENTS FOR THIS LAB REPORT Your name, lab group and collaborators. A clear abstract at the top stating what your major findings are. For this report you should have an opinion about which types of measurements for frequency are most accurate. A clearly labeled data table showing your measurements of frequencies that is used to support your findings. Additional discussion based on the questions above. A good lab report would in its body provide evidence that clearly supports the findings summarized in the abstract. For this lab, a good lab report would have a clear description of how errors in measurements are estimated. It is likely that the most accurate measurements are those with the smallest errors. A good lab report would in words have discussion comparing columns of data in the table. A good lab report would compare the difference between the frequency you measure with the oscilloscope probe and 60 Hz with an error estimated for frequency measurements. This difference would then be used to argue that you did or did not measure 60Hz. If you measured something consistent with 60 Hz (by consistent we mean near or within your estimated error) then it is likely the signal was associated with AC power. Note: A good lab report clearly presents data and discussion that are used to support the summarized results in the abstract --- even if these results are surprising. Contradictory data should be mentioned and discussed rather than hidden. There is no shame is reporting contradictory or surprising experiments. If you suspect your measurements are spurious then you can add discussion speculating about what might have gone wrong in your experiment. It should be possible to get full credit on a lab report even if your experiment fails.* * Electric power in the United States is in the form of alternating current (AC). The voltage on an electric outlet looks like a sine wave (is alternating) with a frequency of 60Hz. The amplitude of the voltage oscillation is approximately 110 Volts. The standard for most of North, Central, and South America and the Caribbean is 60Hz and 120V AC. The standard for much of the rest of the world is 50Hz and 220V AC. Your body, because it is full of electrolytes, conducts electricity and can act as an antenna. The ground level seen by the oscilloscope may differ from the voltage of your body. If you touch one hand to the tip of the probe and the other hand to the ground of the probe you will still see the 60 Hz signal but it will be weaker. 60 Hz noise is often a problem in electronic equipment. You may have heard an undesirable “60 Hz Hum” on a speaker system or electric guitar and we might pick it up when recording sounds later in the term (hence bringing this to your attention now). There are a variety of ways to get rid of 60 Hz noise, including the use of shielded (such as BNC) or twisted cables, humbucker pickups, isolation circuits and well grounded instrument housings.


