Algebra 1 Writing Linear Equations
advertisement
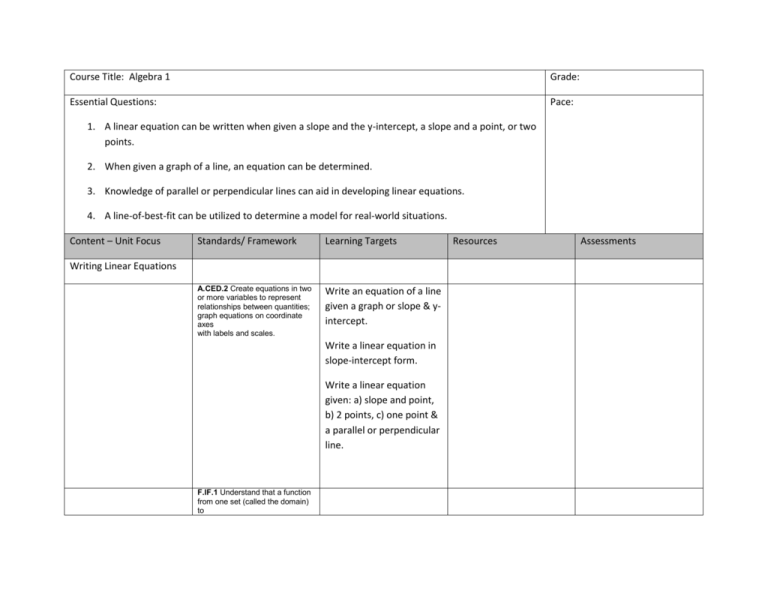
Course Title: Algebra 1 Grade: Essential Questions: Pace: 1. A linear equation can be written when given a slope and the y-intercept, a slope and a point, or two points. 2. When given a graph of a line, an equation can be determined. 3. Knowledge of parallel or perpendicular lines can aid in developing linear equations. 4. A line-of-best-fit can be utilized to determine a model for real-world situations. Content – Unit Focus Standards/ Framework Learning Targets A.CED.2 Create equations in two or more variables to represent relationships between quantities; graph equations on coordinate axes with labels and scales. Write an equation of a line given a graph or slope & yintercept. Writing Linear Equations Write a linear equation in slope-intercept form. Write a linear equation given: a) slope and point, b) 2 points, c) one point & a parallel or perpendicular line. F.IF.1 Understand that a function from one set (called the domain) to Resources Assessments another set (called the range) assigns to each element of the domain exactly one element of the range. If f is a function and x is an element of its domain, then f(x) denotes the output of f corresponding to the input x. The graph of f is the graph of the equation y = f(x). F.IF.2 Use function notation, evaluate functions for inputs in their domains, and interpret statements that use function notation in terms of a context. Rewrite and evaluate linear equations using function notation. F.IF.3 Recognize that sequences are functions, sometimes defined recursively, whose domain is a subset of the integers. For example, the Fibonacci sequence is defined recursively by f(0) = f(1) = 1, f(n+1) = f(n) + f(n-1) for n 1. F.BF.4 Find inverse functions. a. Solve an equation of the form f(x) = c for a simple function f that has an inverse and write an expression for the inverse. For example, f(x) = 2 x3 or f(x) = (x+1)/(x-1) for x ≠ 1. S.ID.6 Represent data on two quantitative variables on a scatter plot, and describe how the variables are related. a. Fit a function to the data; use functions fitted to data to solve problems in the context of the data. Use given functions or choose a function suggested by the context. Emphasize linear Relate rate of change to slope. Create a line-of-best-fit to model data on a scatter and exponential models. b. Informally assess the fit of a function by plotting and analyzing residuals. c. Fit a linear function for a scatter plot that suggests a linear association. S.ID.7 Interpret the slope (rate of change) and the intercept (constant term) of a linear model in the context of the data. S.ID.8 Compute (using technology) and interpret the correlation coefficient of a linear fit. S.ID.9 Distinguish between correlation and causation. plot.

