Lesson 12
NYS COMMON CORE MATHEMATICS CURRICULUM
8•6
Lesson 12: Nonlinear Models in a Data Context
Classwork
Example 1: Growing Dahlias
A group of students wanted to determine whether or not compost is beneficial in plant growth. The students used the
dahlia flower to study the effect of composting. They planted eight dahlias in a bed with no compost and another eight
plants in a bed with compost. They measured the height of each plant over a 9-week period. They found the median
growth height for each group of eight plants. The table below shows the results of the experiment for the dahlias grown
in non-compost beds.
Week
1
2
3
4
5
6
7
8
9
Median Height in Non-Compost
Bed (inches)
9.00
12.75
16.25
19.50
23.00
26.75
30.00
33.75
37.25
Exercises 1–15
1.
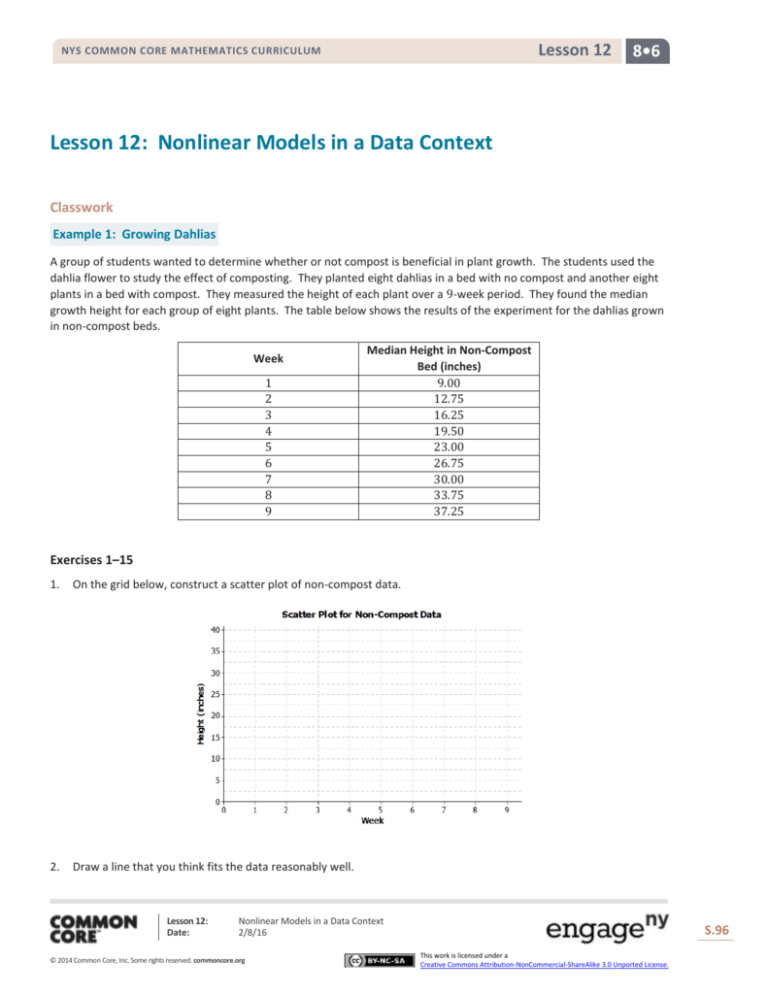
On the grid below, construct a scatter plot of non-compost data.
2.
Draw a line that you think fits the data reasonably well.
Lesson 12:
Date:
Nonlinear Models in a Data Context
2/8/16
© 2014 Common Core, Inc. Some rights reserved. commoncore.org
S.96
This work is licensed under a
Creative Commons Attribution-NonCommercial-ShareAlike 3.0 Unported License.
Lesson 12
NYS COMMON CORE MATHEMATICS CURRICULUM
8•6
3.
Find the rate of change of your line. Interpret the rate of change in terms of growth (in height) over time.
4.
Describe the growth (change in height) from week to week by subtracting the previous week’s height from the
current height. Record the weekly growth in the third column in the table below. The median growth for the
dahlias from Week 1 to Week 2 was 3.75 inches (i.e., 12.75 − 9.00 = 3.75).
1
2
3
4
5
Median Height in
Non-Compost Bed
(inches)
9.00
12.75
16.25
19.50
23.00
6
7
8
9
26.75
30.00
33.75
37.25
Week
Weekly Growth
(inches)
−
3.75
5.
As the number of weeks increases, describe how the weekly growth is changing.
6.
How does the growth each week compare to the slope of the line that you drew?
7.
Estimate the median height of the dahlias at 8 weeks. Explain how you made your estimate.
1
2
Lesson 12:
Date:
Nonlinear Models in a Data Context
2/8/16
© 2014 Common Core, Inc. Some rights reserved. commoncore.org
S.97
This work is licensed under a
Creative Commons Attribution-NonCommercial-ShareAlike 3.0 Unported License.
Lesson 12
NYS COMMON CORE MATHEMATICS CURRICULUM
8•6
The table below shows the results of the experiment for the dahlias grown in compost beds.
Week
1
2
3
4
5
6
7
8
9
Median Height in
Compost Bed (inches)
10.00
13.50
17.75
21.50
30.50
40.50
65.00
80.50
91.50
8.
Construct a scatter plot of height versus week on the grid below.
9.
Do the data appear to form a linear pattern?
Lesson 12:
Date:
Nonlinear Models in a Data Context
2/8/16
© 2014 Common Core, Inc. Some rights reserved. commoncore.org
S.98
This work is licensed under a
Creative Commons Attribution-NonCommercial-ShareAlike 3.0 Unported License.
Lesson 12
NYS COMMON CORE MATHEMATICS CURRICULUM
8•6
10. Describe the weekly growth from week to week by subtracting the height from the previous week from the current
height. Record the weekly growth in the third column in the table below. The median weekly growth for the dahlias
from Week 1 to Week 2 is 3.5 inches. (i.e., 13.5 − 10 = 3.5).
Week
1
2
3
4
5
6
7
8
9
Compost Height
(inches)
10.00
13.50
17.75
21.50
30.50
40.50
65.00
80.50
91.50
Weekly Growth
(inches)
−
3.50
11. As the number of weeks increases, describe how the growth changes.
12. Sketch a curve through the data. When sketching a curve do not connect the ordered pairs, but draw a smooth
curve that you think reasonably describes the data.
1
13. Use the curve to estimate the median height of the dahlias at 8 weeks. Explain how you made your estimate.
2
14. How does the weekly growth of the dahlias in the compost beds compare to the weekly growth of the dahlias in the
non-compost beds?
Lesson 12:
Date:
Nonlinear Models in a Data Context
2/8/16
© 2014 Common Core, Inc. Some rights reserved. commoncore.org
S.99
This work is licensed under a
Creative Commons Attribution-NonCommercial-ShareAlike 3.0 Unported License.
Lesson 12
NYS COMMON CORE MATHEMATICS CURRICULUM
8•6
15. When there is a car accident how do the investigators determine the speed of the cars involved? One way is to
measure the skid marks left by the car and use this length to estimate the speed.
The table below shows data collected from an experiment with a test car. The first column is the length of the skid
mark (in feet) and the second column is the speed of the car (in miles per hour).
Skid-Mark Length (𝐟𝐭.)
5
17
65
105
205
265
Speed (𝐦𝐩𝐡)
10
20
40
50
70
80
a.
Construct a scatter plot of speed versus skid-mark length on the grid below.
b.
The relationship between speed and skid-mark length can be described by a curve. Sketch a curve through the
data that best represents the relationship between skid-mark length and speed of the car. Remember to draw
a smooth curve that does not just connect the ordered pairs.
Lesson 12:
Date:
Nonlinear Models in a Data Context
2/8/16
© 2014 Common Core, Inc. Some rights reserved. commoncore.org
S.100
This work is licensed under a
Creative Commons Attribution-NonCommercial-ShareAlike 3.0 Unported License.
NYS COMMON CORE MATHEMATICS CURRICULUM
Lesson 12
8•6
c.
If the car left a skid mark of 60 ft., what is an estimate for the speed of the car? Explain how you determined
the estimate.
d.
A car left a skid mark of 150 ft. Use the curve you sketched to estimate the speed at which the car was
traveling.
e.
If a car leaves a skid mark that is twice as long as another skid mark, was the car going twice as fast? Explain.
Lesson 12:
Date:
Nonlinear Models in a Data Context
2/8/16
© 2014 Common Core, Inc. Some rights reserved. commoncore.org
S.101
This work is licensed under a
Creative Commons Attribution-NonCommercial-ShareAlike 3.0 Unported License.
Lesson 12
NYS COMMON CORE MATHEMATICS CURRICULUM
8•6
Lesson Summary
When data follow a linear pattern, the rate of change is a constant. When data follow a nonlinear pattern, the rate
of change is not constant.
Problem Set
1.
Once the brakes of the car have been applied, the car does not stop immediately. The distance that the car travels
after the brakes have been applied is called the braking distance. The table below shows braking distance (how far
the car travels once the brakes have been applied) and the speed of the car.
Speed (𝐦𝐩𝐡)
10
20
30
40
50
60
70
80
a.
Distance Until Car
Stops (𝐟𝐭.)
5
17
37
65
105
150
205
265
Construct a scatterplot of distance versus speed on the grid below.
Lesson 12:
Date:
Nonlinear Models in a Data Context
2/8/16
© 2014 Common Core, Inc. Some rights reserved. commoncore.org
S.102
This work is licensed under a
Creative Commons Attribution-NonCommercial-ShareAlike 3.0 Unported License.
Lesson 12
NYS COMMON CORE MATHEMATICS CURRICULUM
b.
Find the amount of additional distance a car would travel after braking for each speed increase of 10 mph.
Record your answers in the table below.
Speed (𝐦𝐩𝐡)
10
20
30
40
50
60
70
80
2.
8•6
Distance Until Car
Stops (𝐟𝐭.)
5
17
37
65
105
150
205
265
Amount of Distance
Increase
−
c.
Based on the table, do you think the data follow a linear pattern? Explain your answer.
d.
Describe how the distance it takes a car to stop changes as the speed of the car increases.
e.
Sketch a smooth curve that you think describes the relationship between braking distance and speed.
f.
Estimate braking distance for a car traveling at 52 mph. Estimate braking distance for a car traveling at
75 mph. Explain how you made your estimates.
The scatter plot below shows the relationship between cost (in dollars) and radius length (in meters) of fertilizing
different sized circular fields. The curve shown was drawn to describe the relationship between cost and radius.
a.
Is the curve a good fit for the data? Explain.
b.
Use the curve to estimate the cost for fertilizing a circular field of radius 30 m. Explain how you made your
estimate.
c.
Estimate the radius of the field if the fertilizing cost were $2,500. Explain how you made your estimate.
Lesson 12:
Date:
Nonlinear Models in a Data Context
2/8/16
© 2014 Common Core, Inc. Some rights reserved. commoncore.org
S.103
This work is licensed under a
Creative Commons Attribution-NonCommercial-ShareAlike 3.0 Unported License.
Lesson 12
NYS COMMON CORE MATHEMATICS CURRICULUM
3.
8•6
A dolphin is fitted with a GPS system that monitors its position in relationship to a research ship. The table below
contains the time (in seconds) after the dolphin is released from the ship and the distance (in feet) the dolphin is
from the research ship.
Time (𝐬𝐞𝐜.)
Distance from
Ship (𝐟𝐭.)
0
50
100
150
200
250
300
0
85
190
398
577
853
1,122
Increase in
Distance from
the Ship
−
a.
Construct a scatter plot of distance versus time on the grid below.
b.
Find the additional distance the dolphin traveled for each increase of 50 seconds. Record your answers in the
table above.
c.
Based on the table, do you think that the data follow a linear pattern? Explain your answer.
d.
Describe how the distance that the dolphin is from the ship changes as the time increases.
e.
Sketch a smooth curve that you think fits the data reasonably well.
f.
Estimate how far the dolphin will be from the ship after 180 seconds? Explain how you made your estimate.
Lesson 12:
Date:
Nonlinear Models in a Data Context
2/8/16
© 2014 Common Core, Inc. Some rights reserved. commoncore.org
S.104
This work is licensed under a
Creative Commons Attribution-NonCommercial-ShareAlike 3.0 Unported License.


