Supporting information
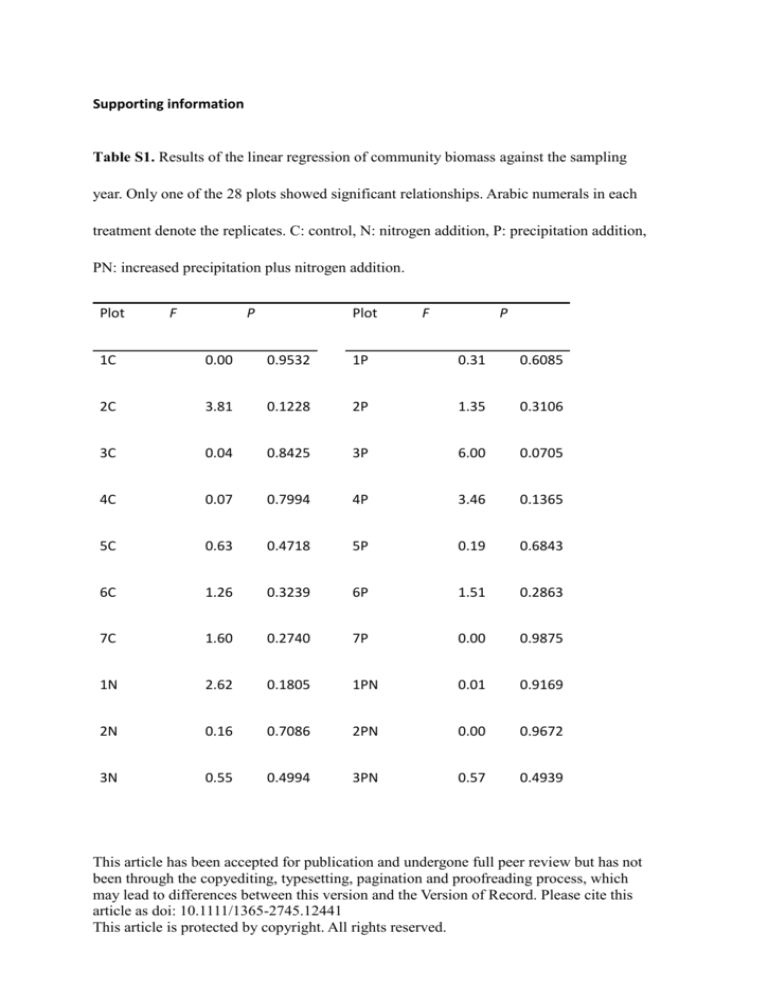
Table S1. Results of the linear regression of community biomass against the sampling
year. Only one of the 28 plots showed significant relationships. Arabic numerals in each
treatment denote the replicates. C: control, N: nitrogen addition, P: precipitation addition,
PN: increased precipitation plus nitrogen addition.
Plot
F
P
Plot
F
P
1C
0.00
0.9532
1P
0.31
0.6085
2C
3.81
0.1228
2P
1.35
0.3106
3C
0.04
0.8425
3P
6.00
0.0705
4C
0.07
0.7994
4P
3.46
0.1365
5C
0.63
0.4718
5P
0.19
0.6843
6C
1.26
0.3239
6P
1.51
0.2863
7C
1.60
0.2740
7P
0.00
0.9875
1N
2.62
0.1805
1PN
0.01
0.9169
2N
0.16
0.7086
2PN
0.00
0.9672
3N
0.55
0.4994
3PN
0.57
0.4939
This article has been accepted for publication and undergone full peer review but has not
been through the copyediting, typesetting, pagination and proofreading process, which
may lead to differences between this version and the Version of Record. Please cite this
article as doi: 10.1111/1365-2745.12441
This article is protected by copyright. All rights reserved.
4N
3.46
0.1363
4PN
8.38
0.0444
5N
4.63
0.0979
5PN
0.79
0.4233
6N
0.71
0.4456
6PN
0.01
0.9450
7N
0.97
0.3807
7PN
4.74
0.0949
Table S2. Results of structural equation modeling of precipitation and nitrogen addition
effects on plant community temporal stability through all plausible interaction pathways
as illustrated in Figure S3. Given are the unstandardized path coefficients (estimates),
standard error of regression weight (S.E.), the critical value for the regression weight
(C.R.), and the level of significance for the regression weight (P). *** indicates P < 0.001.
Path
Estimate
S.E.
C.R.
P
Stability of forbs
<--- Soil moisture
-0.044
0.437
-0.101
0.920
Dominant species stability
<--- Soil moisture
0.188
0.711
0.265
0.791
Stability of grasses
<--- Soil inorganic nitrogen
0.003
0.009
0.296
0.767
Community stability
<--- Soil moisture
-0.154
0.169
-0.911
0.362
Community stability
<--- Stability of grasses
0.062
0.072
0.867
0.386
Species asynchrony
<--- Species richness
-0.010
0.010
-1.029
0.303
Species richness
<--- Soil inorganic nitrogen
-0.070
0.066
-1.056
0.291
Stability of forbs
<--- Soil inorganic nitrogen
-0.018
0.013
-1.357
0.175
Stability of grasses
<--- Species richness
-0.042
0.027
-1.559
0.119
This article is protected by copyright. All rights reserved.
Path
Estimate
S.E.
C.R.
P
Dominant species stability
<--- Soil inorganic nitrogen
-0.035
0.022
-1.556
0.120
Community stability
<--- Stability of forbs
0.066
0.044
1.500
0.134
Species richness
<--- Soil moisture
4.121
2.087
1.974
0.048
Community stability
<--- Species richness
0.022
0.012
1.917
0.055
Stability of grasses
<--- Soil moisture
1.124
0.312
3.600
***
Stability of forbs
<--- Species richness
0.068
0.038
1.820
0.069
Asynchrony
<--- Soil inorganic nitrogen
-0.006
0.003
-1.650
0.099
Asynchrony
<--- Soil moisture
0.432
0.113
3.839
***
Community stability
<--- Asynchrony
2.044
0.191
10.713
***
Community stability
<--- Dominant species stability
0.158
0.028
5.562
***
Table S3. Mean and range of soil moisture (%) and inorganic nitrogen (mg kg-1) across
the sampling years in each treatment. C: control, N: nitrogen addition, P: precipitation
addition, PN: increased precipitation plus nitrogen addition.
Soil moisture (%)
Soil inorganic nitrogen (mg kg-1)
Treatment
Mean
Range
Mean
Range
C
9.29
8.26-10.05
29.28
26.08-31.39
N
10.10
9.15-11.57
48.27
41.26-53.45
P
13.88
12.82-14.22
32.3
28.27-38.73
This article is protected by copyright. All rights reserved.
PN
13.8
11.95-15.78
34.96
This article is protected by copyright. All rights reserved.
32.48-37.22
Table S4. Results (F values) of repeated measures ANOVAs with split plot design on the
effects of treatment time (year), nitrogen addition and increased precipitation, and their
interactions on species richness, dominance, and ANOVAs with split plot design on the
effects of nitrogen addition and increased precipitation, and their interactions on
community above-ground biomass, the stability of community, grasses and forbs, and
community-wide species asynchrony.
Community
Richness
Grasses
Forbs
above-
Community stability stability
Species
ground
stability
asynchrony
Dominance
biomass
Year (Y)
4.36***
3.83**
11.45***
-
-
-
-
Precipitation (P) 27.76*** 6.82*
65.60***
16.83**
6.36*
3.96ns
16.82**
Nitrogen (N)
11.11**
17.52***
98.74***
5.56*
2.26ns
21.59*** 1.22ns
P×N
2.43ns
1.79ns
1.72ns
1.22ns
0.17ns
4.31ns
0.00ns
Y×P
2.06ns
0.75ns
5.03***
-
-
-
-
Y×N
1.36ns
2.23ns
3.06*
-
-
-
-
Y×P×N
2.43*
2.40*
0.80ns
-
-
-
-
Statistical significance: *P < 0.05, **P < 0.01, ***P < 0.001; ns P > 0.05.
This article is protected by copyright. All rights reserved.
Figure S1. The biomass-based ranking of species in the descending order, based on data
Relative species biomass(%)
collected from 2007 to 2012 across all the treatments.
30
25
20
15
10
5
0
0
20
40
60
Species rank in biomass
This article is protected by copyright. All rights reserved.
Figure S2. A-priori structural equation model used in this study. Soil moisture, species
asynchrony, richness, functional group stability, dominant stability, inorganic N and
community stability were included in this model. We established our structural equation
model by taking into account all plausible relationships. There are large differences
between the a-priori model and the final model owing to the removal of paths with nonsignificant coefficients.
Soil moisture
Functional
group stability
Species
asynchrony
Community
stability
Richness
Dominant
stability
Inorganic N
This article is protected by copyright. All rights reserved.
Figure S3. Relationships between soil moisture and (a) species asynchrony, (b)
community biomass, (c) stability of grasses; between soil inorganic nitrogen and (d)
species asynchrony, (e) species dominance; and between species richness and (f)
community biomass, (g) species asynchrony, and (h) summed variance of species
0.7
6
Species dominance
0.5
8 10 12 14 16 18
Soil moisture (%)
(e)
0.4
0.3
0.2
r2 = 0.396
P < 0.001
0.1
20
30
40
50
60
Soil inorganic N (mg kg-2)
300
200
2.0
(c)
r2 = 0.255
P = 0.006
1.5
1.0
0.5
1.0
Species asynchrony
(b)
0.0
100
6
500
400
(f)
r2 = 0.005
P = 0.713
300
200
100
10
6
8 10 12 14 16 18
Soil moisture (%)
12 14 16 18 20
Species richness
1.0
(g)
0.9
0.8
0.7
10
This article is protected by copyright. All rights reserved.
r2 = 0.014
P = 0.688
12 14 16 18
Species richness
20
(d)
0.9
0.8
r2 = 0.192
P = 0.020
0.7
20
30
40
50
60
Soil inorganic N (mg kg-2)
8 10 12 14 16 18
Soil moisture (%)
200
Summed variance
r2 = 0.331
P < 0.001
r2 = 0.368
P < 0.001
Stability of grasses
0.8
400
Species asynchrony
0.9
-2
(a)
Community biomass (g m-2)
Species asynchrony
1.0
Community biomass (gm )
biomass.
150
r2 = 0.022 (h)
P = 0.454
100
50
0
10
12 14 16 18
Species richness
20


