Additional file 1 (Cont.).
advertisement
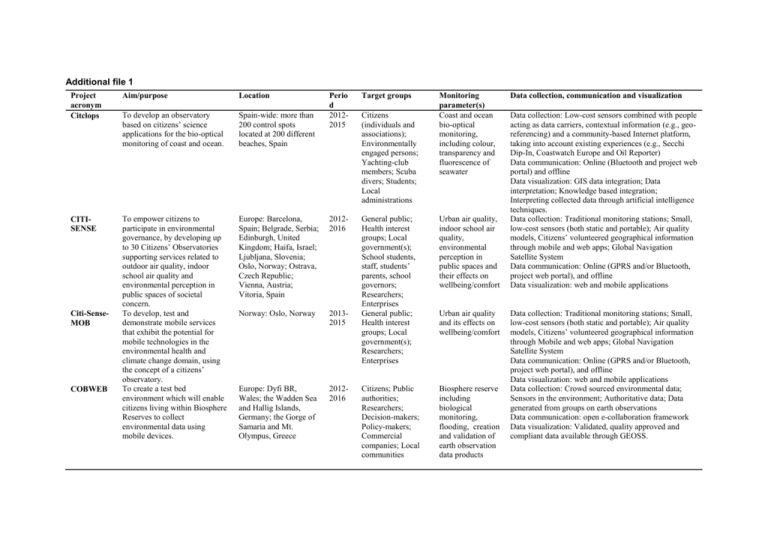
Additional file 1 Project acronym Citclops Aim/purpose Location To develop an observatory based on citizens’ science applications for the bio-optical monitoring of coast and ocean. Spain-wide: more than 200 control spots located at 200 different beaches, Spain CITISENSE To empower citizens to participate in environmental governance, by developing up to 30 Citizens’ Observatories supporting services related to outdoor air quality, indoor school air quality and environmental perception in public spaces of societal concern. To develop, test and demonstrate mobile services that exhibit the potential for mobile technologies in the environmental health and climate change domain, using the concept of a citizens’ observatory. To create a test bed environment which will enable citizens living within Biosphere Reserves to collect environmental data using mobile devices. Citi-SenseMOB COBWEB Perio d 20122015 Target groups Europe: Barcelona, Spain; Belgrade, Serbia; Edinburgh, United Kingdom; Haifa, Israel; Ljubljana, Slovenia; Oslo, Norway; Ostrava, Czech Republic; Vienna, Austria; Vitoria, Spain 20122016 Urban air quality, indoor school air quality, environmental perception in public spaces and their effects on wellbeing/comfort Norway: Oslo, Norway 20132015 General public; Health interest groups; Local government(s); School students, staff, students’ parents, school governors; Researchers; Enterprises General public; Health interest groups; Local government(s); Researchers; Enterprises Europe: Dyfi BR, Wales; the Wadden Sea and Hallig Islands, Germany; the Gorge of Samaria and Mt. Olympus, Greece 20122016 Citizens; Public authorities; Researchers; Decision-makers; Policy-makers; Commercial companies; Local communities Biosphere reserve including biological monitoring, flooding, creation and validation of earth observation data products Citizens (individuals and associations); Environmentally engaged persons; Yachting-club members; Scuba divers; Students; Local administrations Monitoring parameter(s) Coast and ocean bio-optical monitoring, including colour, transparency and fluorescence of seawater Urban air quality and its effects on wellbeing/comfort Data collection, communication and visualization Data collection: Low-cost sensors combined with people acting as data carriers, contextual information (e.g., georeferencing) and a community-based Internet platform, taking into account existing experiences (e.g., Secchi Dip-In, Coastwatch Europe and Oil Reporter) Data communication: Online (Bluetooth and project web portal) and offline Data visualization: GIS data integration; Data interpretation; Knowledge based integration; Interpreting collected data through artificial intelligence techniques. Data collection: Traditional monitoring stations; Small, low-cost sensors (both static and portable); Air quality models, Citizens’ volunteered geographical information through mobile and web apps; Global Navigation Satellite System Data communication: Online (GPRS and/or Bluetooth, project web portal), and offline Data visualization: web and mobile applications Data collection: Traditional monitoring stations; Small, low-cost sensors (both static and portable); Air quality models, Citizens’ volunteered geographical information through Mobile and web apps; Global Navigation Satellite System Data communication: Online (GPRS and/or Bluetooth, project web portal), and offline Data visualization: web and mobile applications Data collection: Crowd sourced environmental data; Sensors in the environment; Authoritative data; Data generated from groups on earth observations Data communication: open e-collaboration framework Data visualization: Validated, quality approved and compliant data available through GEOSS. Additional file 1 (Cont.). Project acronym Eye on Earth Aim/purpose Location Period Target groups To allow users to visualise, create, interact with, and share maps and data on air pollution, water quality and noise levels. Global 2010Current Omniscientis To combine the active participation of the stakeholders, especially citizens, with the implementation of innovative technologies to improve the governance of odour nuisance. Europe: A pig farm, Austria; A major industrial site, Belgium 20122014 Citizens; Scientists and academics; Environmental agencies; NGOs Citizens; Experts; Environmental NGOs; Local authorities; Industries The Big Butterfly Count To raise awareness of the importance of butterflies and moths, to encourage sustainable agriculture and helping to protect the environment. To connect and support local waterkeeper programs to provide a voice for waterways and their communities worldwide. UK-wide: parks, school grounds, gardens, fields or forest 2010Current Public; Butterfly Conservation; UK government Global: over 200 Waterkeeper Organizations on six continents 1999- Citizens and government(s) Water quality To enable citizens to become active stakeholders in information capturing, evaluation and communication for the water environment including flood risk. Europe: Doncaster, United Kingdom; Delftland, Netherlands; Alto Adriatico, Italy 20122016 Citizens; Authorities; Academic institutions; Research centres; Industries Water environment including flood risk (e.g., sonar water Level, temperature, humidity, wind speed, rainfall, soil moisture, water depth gauges, water velocity, snow depth, water quality) Waterkeeper Alliance WeSenseIt Monitoring parameter(s) Water, air, noise, climate change, biodiversity, land use Odour and its effects on human health including odour perception, discomfort and nuisance from industries The numbers of butterfly, species of butterfly Data collection, communication and visualization Data collection: Crowd source’ environmental information on earth Data communication: Online (project web portal) Data visualization: GIS-based web maps Data collection: In-situ sensors (e-noses and meteorological station); Citizens’ observatories via a geo-mobile application; Specific odour dispersion model Data communication: Web-based service platform and offline Data visualization: web and mobile applications Data collection: Data communication: Online via project’s website or via a smartphone app Data visualization: Butterfly identification chart, butterfly pictures Data collection: Satellite images and mapping; Aerial reconnaissance and photography; On-thewater observation and sampling. Data communication: both online and offline Data visualization: layer-based Data visualization Data collection: Innovative sensor devices developed within the project used by the citizens; Citizens’ collective intelligence via social media (e.g. Twitter, Facebook, etc.); Communities to upload key information to the observatory via mobile app. Data communication: Web-based service platform Data visualization: web and mobile applications

