Studies A & B
advertisement
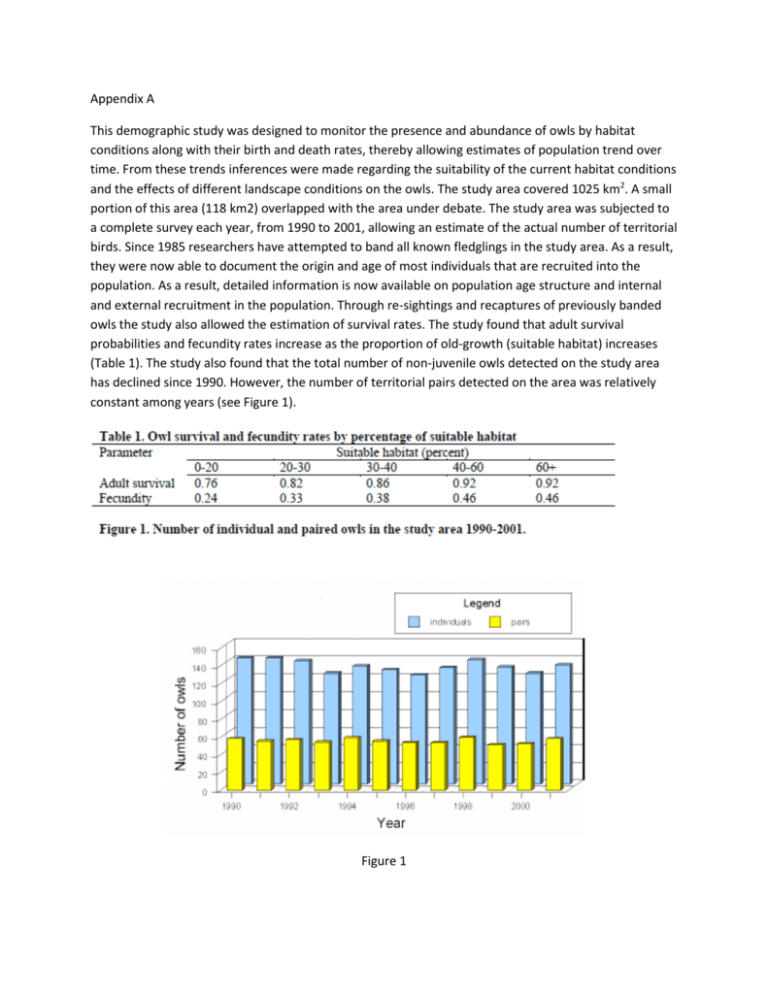
Appendix A This demographic study was designed to monitor the presence and abundance of owls by habitat conditions along with their birth and death rates, thereby allowing estimates of population trend over time. From these trends inferences were made regarding the suitability of the current habitat conditions and the effects of different landscape conditions on the owls. The study area covered 1025 km2. A small portion of this area (118 km2) overlapped with the area under debate. The study area was subjected to a complete survey each year, from 1990 to 2001, allowing an estimate of the actual number of territorial birds. Since 1985 researchers have attempted to band all known fledglings in the study area. As a result, they were now able to document the origin and age of most individuals that are recruited into the population. As a result, detailed information is now available on population age structure and internal and external recruitment in the population. Through re-sightings and recaptures of previously banded owls the study also allowed the estimation of survival rates. The study found that adult survival probabilities and fecundity rates increase as the proportion of old-growth (suitable habitat) increases (Table 1). The study also found that the total number of non-juvenile owls detected on the study area has declined since 1990. However, the number of territorial pairs detected on the area was relatively constant among years (see Figure 1). Figure 1 Appendix B A highly respected statistics professor, in collaboration with wildlife biologists, did the study. This study reports results of a monitoring effort that has been lasted almost a decade and included data from a network of 11 sites (one of these sites is included in the area under debate) across the owl range. Data collection consisted in capturing owls and marking them with identification bands. Both adult and juvenile birds were marked. Periodic revisit of the study sites would then be carried out to recapture birds (and mark the unmarked ones). Recapture and re-observation over time would then allow estimating annual survival probabilities of adults and juveniles. The study employed a rigorous sampling design. Given standard assumptions usually made in capture-recapture models, survival probabilities can be estimated as a function of the recapture rate. These assumptions included: • Study areas are representative of the habitat of interest; • Capture, handling, banding and release do not affect survival; • There is no band loss, and no bands are misread on capture or resighting; • Any unknown emigration out of the study area is permanent; • The fate of each individual owl, after release, is independent of the fate of any other owl; • Data sets for the various ages, sexes, and areas are statistically independent; and • All owls of an identifiable class (e.g., sex, age) have the same survival and capture probability, by study area (parameter homogeneity). Estimates of survival probabilities can be used to estimate the overall rate of population growth for the adult population. A rate of population growth (_) equaling 1.0 indicates that the population is stable. Thus, _<1.0 or >1.0 indicate that the population is decreasing or increasing respectively. For example, a value of _=0.99 reflects a population that is decreasing at 1 percent per year. The results for juvenile and adult survival, along with overall population growth (_) are reported in Table 2. Table 2 illustrates that the owl population has declined in 10 out of 11 sites, at a statistically significant rate. Detailed inspection of the data indicates that the decline was primarily coming from the survival probabilities of adult annual females (see Figure 2). The results for male adults were not statistically significant but exhibited the same negative trend. Summary statistics for the overall population (males and females) showed that the population of resident territorial birds is declining. These results have been corrected for emigration and immigration although, admittedly, emigration and immigration data are poor. The final conclusion of the study was that the rate of decline is accelerating (the second derivative of the time trend – the empty circles – in Figure 2 is positive). Figure 2. Estimated survival probabilities of adult female owls as a function of years 1994-2001. A significant negative trend is indicated by the nearly linear line. The black circles are individual year estimates of survival rates.

