Summary
advertisement
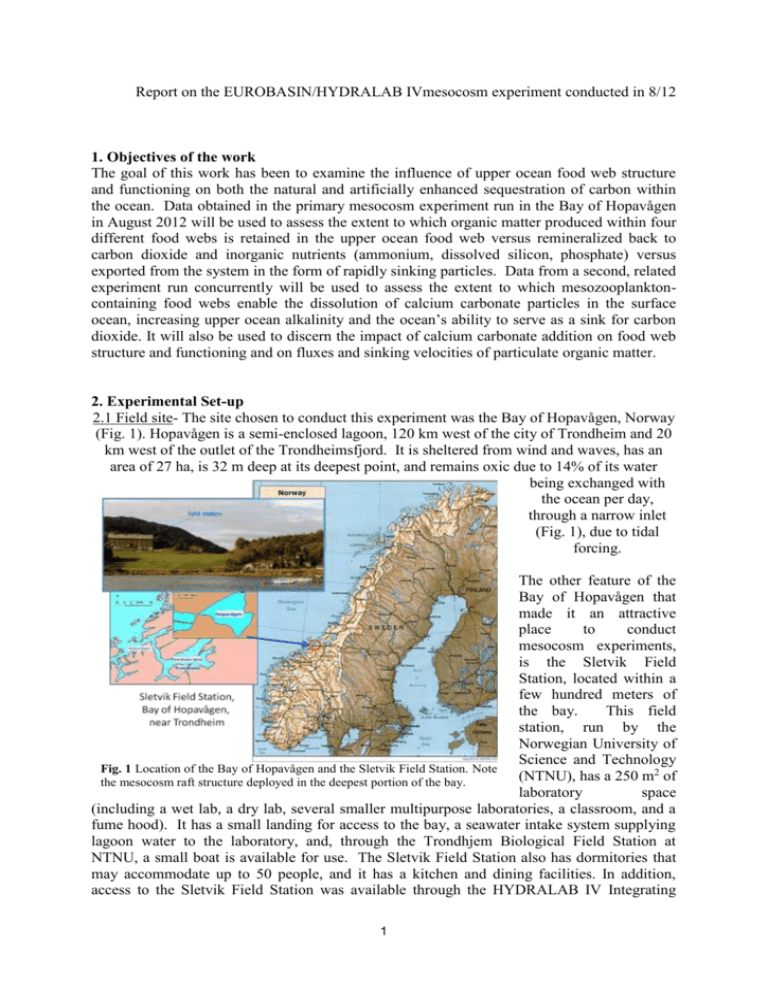
Report on the EUROBASIN/HYDRALAB IVmesocosm experiment conducted in 8/12 1. Objectives of the work The goal of this work has been to examine the influence of upper ocean food web structure and functioning on both the natural and artificially enhanced sequestration of carbon within the ocean. Data obtained in the primary mesocosm experiment run in the Bay of Hopavågen in August 2012 will be used to assess the extent to which organic matter produced within four different food webs is retained in the upper ocean food web versus remineralized back to carbon dioxide and inorganic nutrients (ammonium, dissolved silicon, phosphate) versus exported from the system in the form of rapidly sinking particles. Data from a second, related experiment run concurrently will be used to assess the extent to which mesozooplanktoncontaining food webs enable the dissolution of calcium carbonate particles in the surface ocean, increasing upper ocean alkalinity and the ocean’s ability to serve as a sink for carbon dioxide. It will also be used to discern the impact of calcium carbonate addition on food web structure and functioning and on fluxes and sinking velocities of particulate organic matter. 2. Experimental Set-up 2.1 Field site- The site chosen to conduct this experiment was the Bay of Hopavågen, Norway (Fig. 1). Hopavågen is a semi-enclosed lagoon, 120 km west of the city of Trondheim and 20 km west of the outlet of the Trondheimsfjord. It is sheltered from wind and waves, has an area of 27 ha, is 32 m deep at its deepest point, and remains oxic due to 14% of its water being exchanged with the ocean per day, through a narrow inlet (Fig. 1), due to tidal forcing. The other feature of the Bay of Hopavågen that made it an attractive place to conduct mesocosm experiments, is the Sletvik Field Station, located within a few hundred meters of the bay. This field station, run by the Norwegian University of Science and Technology Fig. 1 Location of the Bay of Hopavågen and the Sletvik Field Station. Note (NTNU), has a 250 m2 of the mesocosm raft structure deployed in the deepest portion of the bay. laboratory space (including a wet lab, a dry lab, several smaller multipurpose laboratories, a classroom, and a fume hood). It has a small landing for access to the bay, a seawater intake system supplying lagoon water to the laboratory, and, through the Trondhjem Biological Field Station at NTNU, a small boat is available for use. The Sletvik Field Station also has dormitories that may accommodate up to 50 people, and it has a kitchen and dining facilities. In addition, access to the Sletvik Field Station was available through the HYDRALAB IV Integrating 1 Activity of the European FP7. Access was applied for by De La Rocha and then granted from HYDRALAB IV (as project HyIV-NTNU-01) for 36 days in July-August 2012. On-site participants in the experiment were largely drawn from EUROBASIN partner institutes (CNRS at Brest, NOC Southampton, University of Hamburg, DTU-Aqua, and MARUM at the University of Bremen). There were also personnel, associated with NTNU and the University of Munich, who provided critical basic support for the work. 2.2 Experimental setupThe primary experiment focusing on food webs, organic matter cycling, and the formation and sinking of large, rapidly sinking aggregates (a type of “marine snow”) was carried out in a set of 12 mesocosms covering, in triplicate, 2 different phytoplankton communities (diatom versus non-diatom) exposed to 2 different zooplankton communities (–copepod and +copepod) (Fig. 2). These starting conditions were established by first filling the bags, roughly simultaneously, with seawater from the Bay of Hopavågen. Mesozooplankton were then removed to the most complete extent possible immediately removed from half of the mesocosms through repeated vertical hauls of a plankton net (200 µm mesh). Fig. 2 The distribution of mesocosms on mesocosm raft. Each larger Nitrate and phosphate was added to half mesocosms the mesocosm raft ring held four daily to promote the growth of non-siliceous mesocosms. Three of the larger rings phytoplankton (e.g. dinoflagellates or were used for the primary experiment, coccolithophores). To the other half of the and three of the rings were used for the mesocosms, nitrate, phosphate, and silicate were calcium carbonate experiment. added to promote the growth of diatoms. Material was allowed to settle and the two distinct phytoplankton populations were allowed to develop for 4 days, after which copepods collected from the Bay of Hopavågen were added back to the half of the N+P mesocosms and to the half of the N+P+Si mesocosms from which mesozooplankton had not been removed at the beginning. This yielded a set of four initial starting conditions (N+P–copepods, N+P+copepods, N+P+Si–copepods, and N+P+Si+copepods) (Fig. 2). The calcium carbonate mesocosms of the secondary experiment received daily additions of N+P+Si equivalent to those added to the primary experiment mesocosms. In addition, a suspension of calcium carbonate was added every evening so that there were 3 controls (no added calcium carbonate) plus 3 replicates of 3 different daily additions of calcium carbonate. The zooplankton population was left undisturbed for the first week, then supplemented with addition copepods during the second half of the experiment. The mesocosms used in the experiment were approximately 9000 L in volume, with a diameter of 1.08 m and an average depth of 9.6 m. The bags were made of white plastic and were deployed from the raft structure which was anchored in the deepest part of the Bay of Hopavågen (Figs. 1 & 3). 2 2.3 Sampling The primary mesocosms were sampled using a 1.5-m, 5-L integrated water sampler lowered by hand to sample the 3-4.5 m depth interval (Fig. 3). Repeated deployments of the integrated sampler allowed for samples of up to 20-L of water to be collected in LDPE carboys, allowing for measurements of dissolved and particulate components (e.g., particulate organic carbon, biogenic silica, dissolved organic carbon, nutrients, pigments, etc) to be made on subsamples of the same water. Water was collected before breakfast every morning and brought back to the lab. Subsamples were removed in the lab for filtration after gentle mixing of the water in each carboy. Samples from the calcium carbonate mesocosms were taken using a submersible pump, to avoid aerating the samples (which would interfere with the accurate determination of carbonate system parameters such as pH, total dissolved inorganic carbon (DIC), and total alkalinity (TA). Fig. 3 Mesocosms being sampled using the integrated water sampler. When full, the sampler is emptied into a bucket and then the water is transferred into a 20-L carboy and the process was repeated until the required sample volume was reached. Generally, ~15 L of water was collected for each mesocosm at each sampling time. Over the course of the experiment, the primary mesocosm bags were sampled 6 times, on days 1, 4, 6 10, 13, and 16 (Table 1), while the calcium carbonate mesocosms were generally sampled every second day. In addition, sediment traps were deployed in a subset of the mesocosms in both experiments and allowed to collect material for 4-6 days before removal (Table 1). Three sediment trap deployments were made and the material was used for the determination of mass fluxes of particulate organic carbon, transparent exopolymer particles, biogenic silica, and etc. In addition to the normal sediment traps, gel traps were also deployed (on a similar but not perfectly overlapping schedule) in order to obtain a visual record of the material settling through the water column in the mesocosms. The vertical density structure of the water column, the vertical distribution of chlorophyll, integrated chlorophyll content, and the light climate in the mesocosms was monitored using casts of a CTD and a light meter. CTD casts were carried out three times for the primary mesocosms and several additional times for the calcium carbonate mesocosms. 2.4 Sample handling In the primary mesocosms, samples for a set of core parameters were taken every time the mesocosms were sampled (Table 2). Samples for particulates (PIC, BSi, POC, PON, TPP, pigments, and TEP, as defined in Table 2) were collected on GF/F or 0.4 µm polycarbonate 3 Table 1: Work Done July 31 - August 29 2012 Sun Mon Tue July 30 First set of researchers arrive at Sletvik Field Station. 5 Wed July 31 Mesocosm bags made. Mesocosm rings and raft built. 6 7 Thu Fri 1 More mesocosm bags made. Raft set in place. Weights for mesocosm bags made. Agg Bag T0 at 7:00 2 Agg Bags filled with water. First nutrients added to Agg Bags. 8 Sat 3 Calc Bags filled. Zooplankton removed from 6 Agg Bags. Sediment traps tested. First nutrients added to Calc Bags. 9 10 Day for rest, tests, and setup of labs. Copepods added to 6 Agg Bags. Testing, lab setup continues. Zooplankton enumeration in Agg Bags. Agg Bags 1st sampling, Incl. size fr samples First Calcite additions to Calc Bags 1st Aggregation Experiment started. Calc Bags sampling. Sed traps deployed (10pm). Agg Bags 2nd sampling Copepods collected for 1st Zoop Exp (Agg Bags). 12 Sampling of 1st Agg Exp (cont). 1st Zoop Exp Ends. 13 Agg Bags 3rd sampling Sampling of 1st Agg exp (cont) Zoop collection for 2nd zoop exp (Calc Bags) Calc sampling. 14 Sampling of 1st Agg Exp (cont) Sed traps removed 3pm. Agg Bag T168 at 7:00 15 CTD + light profiles Zoop enumeration Sed traps deployed Start of 2nd Zoop Exp (Calc Bags) Calc sampling 16 End 2nd Zoop Exp (Calc Bags) More zoops added to Calc Bags Agg Bags 4th sampling Calc sampling. 19 Sed traps removed Calc sampling Sampling 2nd Agg Exp. Start 3rd Zoop Exp (Agg Bags) 26 Calc Bags removed Sampling 3rd Agg Exp (cont) Mesocosm raft retrieved and dismantled. 20 Agg Bags 5th sampling Sed traps deployed Sampling 2nd Agg Exp (cont) End 3rd Zoop Exp (Agg Bags) 27 Dismantling of mesocosm raft finished Boxes packed. 21 11 Sampling of 1st Agg Exp. 1st Zoop Exp started. Calc Bags sampling. 17 18 Zoops collected for 3rd Zoop Exp (Agg Bags) 2nd Agg Exp started (Calc Bags) 25 Calc sampling Sampling 3rd Agg Exp Agg Bags removed. Samples taken of bags. 22 Calc sampling. Sampling 2nd Agg Exp (cont) Size fractionated samples taken for trophic flow 3rd Agg Exp (Agg Bags) started Agg Bag T360 at 7:00 23 Agg Bags 6th sampling Calc sampling Sampling 3rd Agg Exp 24 Zoop enumeration Agg Bags and Calc Bags. Sed traps removed. CTD + light 28 Packing completed. Boxes picked up. Lab cleaned up 29 Frozen good shipped. Final group of researchers departed Sletvik Field Station. 30 31 4 4 Copepods collected and put in lab before addition to mesocosms. Jellies removed from Agg Bags for the first time. filters and then dried or frozen, as appropriate for later measurement. Table 2: Core parameters measured in the primary Samples for counts of mesocosm experiment nutrients particulate organic carbon (POC) phytoplankton, zooplankton, dissolved silicon particulate organic nitrogen (PON) bacteria, and viruses were nitrate total particulate phosphorus (TPP) preserved for later determination. nitrite biogenic silica (BSi) ammonium particulate inorganic carbon (PIC) Samples for dissolved constituents phosphate transparent exopolymer particles (TEP) (nutrients, DOC, DON, DOP) pigments dissolved organic carbon (DOC) were filtered to removed bacteria dissolved organic nitrogen (DON) particles then frozen for later viruses dissolved organic phophorus (DOP) analysis (except for dissolved phytoplankton (Lugol’s) phytoplankton (flow cytometer) silicon and nitrate concentrations, which were measured on site in Norway as the experiment progressed). In addition to these samples, on several dates, size-fractionated samples were taken for POC and PON. Samples from the calcium carbonate experiments were handled in a similar fashion. Material from sediment traps was allowed to settle for 4 hours, the concentrated by siphoning off excess water from the sediment trap. The collected material was then split into 8 equivalent portions and the portions used for determinations of POC, PON, BSi; PIC, TEP, TPP, and phytoplankton (and microzooplankton). The material collected in gel traps was photographed for later image analysis. 3. Side experiments Three key side experiments were performed in parallel with the mesocosms. The first looked at the vital statistics of zooplankton incubated in water from different mesocosm treatments. The second looked at the formation of aggregates and the character and sinking velocity of the aggregates formed in water from different mesocosm treatments (when incubated in roller tanks specialized for this purpose). The third investigated the feeding of zooplankton on aggregates from the different types of mesocosms. 4. Preliminary results Different standing stocks of biomass and sinking fluxes were quickly established between the different treatments in the primary mesocosm experiment. After one week, the +Si mesocosms, representing a diatom-dominated phytoplankton community, contained 4 times more chlorophyll, 10 times more net nitrate utilization, and notably greater sinking fluxes than the mesocosms that lacked silicon and therefore were dominated by smaller, non-siliceous phytoplankton (Table 3; Fig. 4) Table 3: Depth-integrated chlorophyll (mg) in the primary mesocosm experiment Treatment Day 8 Day 17 N+P+Si 6 ±3 17 ± 14 N+P+Si+copepods 21 ± 7 48 ± 16 N+P 2 ± 0.3 12 ± 5 N+P+copepods 4 ±2 20 ± 11 5 The total amount of chlorophyll suspended in the water column in the mesocosms increased throughout the experiment, along with a marked decrease in the amount of flux as diatomdominated communities made way for non-siliceous phytoplankton in all mesocosms. During the final 10 days, daily net nitrate utilization was similar 4.0 M1 3.5 M2 M3 3.0 Nitrate (µM) M4 2.5 M5 2.0 M6 M7 1.5 M8 1.0 M9 0.5 M10 0.0 8/7/2012 8/11/20128/15/20128/19/20128/23/2012 Date M11 M12 Fig. 4 Evolution of the nitrate concentration in the different primary mesocosms. Mesocosms 1-3 are N+P+Si, 4-6 are N+P+Si+copepod, 7-9 are N+P, and 10-12 are N+P+copepod. The black line represents the expected increase in nitrate concentration due to the daily nitrate addition (i.e. it represents the case of no net nitrate uptake). among all treatments and approximately equal to the daily nitrate addition. Net silicate uptake ceased by day 9 in the +Si mesocosms, indicating a temporary collapse in the diatom community, but resumed by day 12. Sinking fluxes during the last week of the experiment were minor in all mesocosms (although they were still markedly highest in the two +Si treatments, despite the temporary collapse of the diatom community). The different zooplankton communities significantly affected the composition of sinking fluxes (phytoplankton aggregates, fecal pellets, appendicularian houses) but had less influence on the quantity of material sinking. Although there are many more results to come in as we work through our sample set, it is clear that we have succeeded with the main objectives of the experiment, which were to establish a matrix of different phytoplankton and zooplankton communities to see if this would result in different levels of phytoplankton growth, nutrient cycling, and sinking carbon flux. At this time, we can already say that these things all appear to be true. 5. Remaining work Through the end of 2012 and into January 2013, we have been analyzing the samples that have been brought back from the experiment. Most of this work will have been carried out in Brest, France. The carbonate system measurements and the measurements of DOC and DON, however, will be measured by the team in Southampton (at the National Oceanography Centre), and the counts of mesozooplankton abundance and related work for the vital statistics will be done at the University of Hamburg. 6 As data are acquired and cleared through a process of quality control, they will be archived in the PANGAEA database. For the first two years, we would prefer them to be password protected (i.e. available only to experiment participants) and after that, open to public access. A series of“post-mesocosm” data meetings will be held for participants via teleconferencin beginning in March 2013 to facilitate data analysis and the planning and writing of papers. It is possible that we may try to group the resulting papers together for publication as a special issue of a journal. It is, however, not yet clear whether or not this is the best course of action. The first presentation based on results from the experiment will be given by De La Rocha et al as a talk at the Aquatic Sciences Meeting in New Orleans in February 2013 in a session focusing on food web interactions and sinking fluxes of carbon via the biological pump. 7
