AP Bio Redesign Lab Review
advertisement
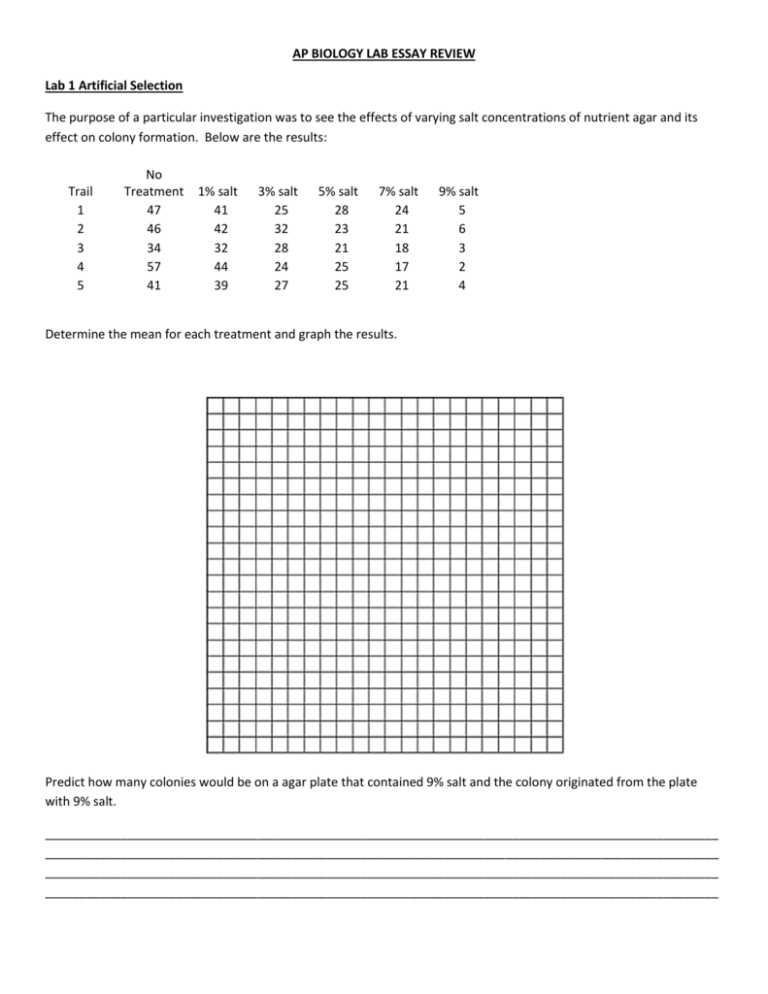
AP BIOLOGY LAB ESSAY REVIEW Lab 1 Artificial Selection The purpose of a particular investigation was to see the effects of varying salt concentrations of nutrient agar and its effect on colony formation. Below are the results: Trail 1 2 3 4 5 No Treatment 47 46 34 57 41 1% salt 41 42 32 44 39 3% salt 25 32 28 24 27 5% salt 28 23 21 25 25 7% salt 24 21 18 17 21 9% salt 5 6 3 2 4 Determine the mean for each treatment and graph the results. Predict how many colonies would be on a agar plate that contained 9% salt and the colony originated from the plate with 9% salt. __________________________________________________________________________________________________ __________________________________________________________________________________________________ __________________________________________________________________________________________________ __________________________________________________________________________________________________ Explain how this is an example of artificial selection __________________________________________________________________________________________________ __________________________________________________________________________________________________ __________________________________________________________________________________________________ Explain how this may happen as an example of natural selection __________________________________________________________________________________________________ __________________________________________________________________________________________________ __________________________________________________________________________________________________ Lab 2 Hardy-Weinberg 1. The frequency of two alleles in a gene pool is 0.1 9(A) and 0 .81(a). What is the percentage in the population of heterozygous individuals? What is the percentage of homozygous recessives? Assume that the population is in Hardy-Weinberg equilibrium. 2. An allele W, for white wool, is dominant over allele w, for black wool. In a sample of 900 sheep, 891 are white and 9 are black. Estimate the allelic frequencies in this sample, assuming that the population is in equilibrium. 3. In a population that is in Hardy-Weinberg equilibrium, the frequency of the recessive homozygote genotype of a certain trait is 0.09. What is the percentage of individuals homozygous for the dominant allele? 4. In a population that is in Hardy-Weinberg equilibrium, 38 % of the individuals are recessive homozygotes for a certain trait. In a population of 14,500, how many of the individuals will be homozygous dominant individuals, and heterozygous individuals. 5. Allele T, for the ability to taste a particular chemical, is dominant over allele t, for the inability to taste it. At a university, out of 400 surveyed students, 64 were found to be nontasters. What is the percentage of heterozygous students? Assume that the population is in equilibrium. 6. In humans, Rh-positive individuals have the Rh antigen on their red blood cells, while Rh-negative individuals do not. Assume that a dominant gene Rh produces the Rh-positive phenotype, and the Rhnegative phenotype produces by its recessive allele rh. In a population that is in Hardy-Weinberg equilibrium, if 160 out of 200 individuals are Rh-positive, what are the frequencies of the Rh allele and the rh allele at this locus? 7. In corn, yellow kernel color is governed by a dominant allele for white color W and, by its recessive allele, w. A random sample of 100 kernels from a population that is in equilibrium reveals that 9 are yellow and 91 are white. What are the frequencies of the yellow and white alleles in this population? What is the percentage of heterozygotes in this population? Lab 3 Comparing DNA sequences Below are strands of DNA from 4 different species. Base on the DNA sequence, answer the following questions. I. A C C G G T T A A A C A T T A G G G A C C T T A T G G A A A A C T C A C G A G C C C G G A T T A G G C II . A C C G G T T T A A C A T T A G G C A C C T T A T G G G A A A C T C A T G A G C C C G G A T T A G G C III. A C C G G T TG A A C A T T A G G C A C C T T A T G G G A A A C T C A T G A G C C C G G A T T A G G G IV. A T C G G T C G A A C A T T A G A C C T T A T G G G A A A C T C A T G A G C G C G C A T T A G G G 1. Which two species are most closely related and why? __________________________________________________________________________________________________ __________________________________________________________________________________________________ __________________________________________________________________________________________________ __________________________________________________________________________________________________ 2. Which species is more distantly related to the other species and why? __________________________________________________________________________________________________ __________________________________________________________________________________________________ __________________________________________________________________________________________________ __________________________________________________________________________________________________ 3. What sorts of mutations are found in the DNA of species # 2 when compared to species #3? How will that affect the resulting protein? __________________________________________________________________________________________________ __________________________________________________________________________________________________ __________________________________________________________________________________________________ 4. What sorts of mutation are found in the DNA of species #3 when compared to the species #4? How will that affect the resulting protein? __________________________________________________________________________________________________ __________________________________________________________________________________________________ __________________________________________________________________________________________________ Lab 4 Osmosis A student was working with potato cores and sucrose solutions with varying molarities. The molarities of the solutions were 0, 0.2,0 .4, 0.6, 0.8, and 1.0. The student measured the initial mass of the potato cores and then after 24 hour the student measures the cores again. The student then realizes that the molarities of the beakers were never labeled. Based on the percent change mass of the potato cores determine the molarity of each solution. Also determine the water potential of each solution. Graph the percent change in mass versus the molarities of the solutions and determine the molarity where the potatoes were isostonic.________________________________________________________ Lab 5 Photosynthesis An experiment involved plant tissue disks submerged in a solution of water and sodium bicarbonate. The time it took for the disk to float to the top of the solution was recorded. Graph the data below and determine the median time it took for 5 disc to rise to the top or ET 50 . This experiment was repeated four times varying the light intensity of the light. The data was recorded below . Determine 1/ET50. Graph the light intensity versus 1/ET50. Does this relationship seem to be proportional? __________________________________________________________________________________________________ Draw in a line if this experiment were repeated under varying light intensities of green light. Justify your how you drew your line. __________________________________________________________________________________________________ __________________________________________________________________________________________________ Design an experiment that to investigate another factor of photosynthesis and the protocol you would use and also justify the results you would expect. __________________________________________________________________________________________________ __________________________________________________________________________________________________ __________________________________________________________________________________________________ __________________________________________________________________________________________________ __________________________________________________________________________________________________ __________________________________________________________________________________________________ Lab 6: Cellular Respiration Below is data presented from an investigation comparing the oxygen consumption of germinating pea at 25o C versus germinating peas at 10o C. Use the data table to create an appropriate graph. Time (min) Amount of CO2 (grams) 10°C 18°C 25°C 0 0.0 0.0 0.0 5 0.3 0.6 0.9 10 0.5 0.9 1.4 15 0.7 1.2 1.9 20 0.9 1.5 2.4 1. What is the effect of temperature on the rate of cellular respiration? __________________________________________________________________________________________________ 2. Determine the average rate of respiration for germinating peas at 10oC and 25oC. __________________________________________________________________________________________________ Lab 7 Mitosis Above is an onion root tip observed under a microscope. In the data table shown below, count the number of cells in each phase of mitosis. Combine prophase and prometaphase. Phase Interphase Prophase/prometaphase Metaphase Anaphase Telophase Number Percent spent in each phase Determine the percentage of cells spent in interphase versus mitosis. If the life cycle of the onion root tip cell is 24 hours, how many minutes will the average cell spend in phase of mitosis. Phase Interphase Prophase/prometaphase Metaphase Anaphase Telophase Minutes spent in each phase This is a root tip that has been treated with a 1 M concentration of caffeine. Determine the percentage of cell involved in mitosis. Does it appear that caffeine has an effect on the number of cells involved in mitosis? Do a Chi-square analysis that determines whether a 1 M concentration of caffeine significantly affects mitosis. Root tip (Get the Data from Part I Phase Count Interphase Mitosis Total Cell Count Root tip treated with caffeine Phase Count Interphase Mitosis Total Cell Count Percentage in mitosis untreated = Percentage in interphase untreated= Mitosis Observed Expected Difference Chi square calculation Is this value significant? Interphase Lab 8: Bacteria Transformation A scientist is using an amplicillin-sensitive strain of bacteria that cannot use lactose because it has a nonfunctional gene in the lac operation. She has two plasmids. One contains a functional copy of the affected gene of the lac operon, and the other contains the gene for amplicillin resistance. Using restriction enzymes and DNA ligase, she forms a recombinant plasmid containing both genes. She then adds a high concentration of the plasmid to a tube of the bacteria in a medium for bacterial growth that contains glucose as the only energy source. This tube (+) and a control tube (-) with similar bacteria but no plasmid are both incubated under the appropriate conditions for growth and plasmid uptake. The scientist then spreads a sample of each bacterial culture (+ and -) on each of the three types of plates indicated below. 1. If no new mutations occur, it would be most reasonable to expect bacterial growth on which of the following plates and be sure to justify your answer __________________________________________________________________________________________________ _________________________________________________________________________________________________ 2. Why were restriction enzymes used in this experiment? __________________________________________________________________________________________________ __________________________________________________________________________________________________ 3. If DNA ligase was not used during the preparation of the recombinant plasmid, bacterial growth would most likely have occurred on which plates and justify your answer. __________________________________________________________________________________________________ 4. If another experiment was done with the cultures as shown above, using medium that contained lactose as the only energy source, growth would most likely occur on which of the following plates? __________________________________________________________________________________________________ __________________________________________________________________________________________________ Lab 9: DNA Restriction Enzyme and Electrophoresis The diagram below shows a segment of DNA with a total length of 4900 base pairs. The arrows indicate reaction sites for two restriction enzymes (enzyme X and enzyme Y). 1. Explain how the principles of gel electrophoresis allow for the separation of DNA fragments. ___________________________________________________________________________________________________________ ___________________________________________________________________________________________________________ 2. Describe result you would expect from the electrophoretic separation of fragment from the following treatment of the DNA segment above. Assume that the digestions occurred under appropriate conditions and went to completion. I.DNA digested with only enzyme X II.DNA digested with only enzyme Y III. DNA digested with enzyme X and Y IV. Undigested DNA _________________________________________________________________________________________________ _________________________________________________________________________________________________ _________________________________________________________________________________________________ 3. Explain both of the following. The mechanism of action of restriction enzymes, and the different result you would expect if a mutation occurred at the recognition site for enzyme Y. One female and two male adult hawks nested together. All the birds hunted in group and caught prey to feed the three nestlings. The female spend the most itme I the nest, but allowed Male C to help care for the nestlings. Male C would chase male B away. Prove who the parents are and how DNA technology aided in this quest. Lab 11: Transpiration 1. Explain the results of the lab in terms of water potential. __________________________________________________________________________________________________ __________________________________________________________________________________________________ __________________________________________________________________________________________________ 2. Why was it important to divide the water loss by the surface area of the leaves? __________________________________________________________________________________________________ __________________________________________________________________________________________________ Lab 12: Animal Behavior The activities of organisms change at regular time intervals. These changes are called biological rhythms. The graph depicts the activity cycle over a 48-hour period for a fictional group of mammals called pointy-eared bombats, found on an isolated island in the temperate zone. (a) Describe the cycle of activity for the bombats. Discuss how three of the following factors might affect the physiology and/or behavior of the bombats to result in this pattern of activity. _ temperature _ food availability _ presence of predators _ social behavior (b) Propose a hypothesis regarding the effect of light on the cycle of activity in bombats. Describe a controlled experiment that could be performed to test this hypothesis, and the results you would expect. ________________________________________________________________________________________________ ________________________________________________________________________________________________ ________________________________________________________________________________________________ ________________________________________________________________________________________________ ________________________________________________________________________________________________ ________________________________________________________________________________________________ ________________________________________________________________________________________________ ________________________________________________________________________________________________ ________________________________________________________________________________________________ ________________________________________________________________________________________________ ________________________________________________________________________________________________ ________________________________________________________________________________________________ ________________________________________________________________________________________________ Part II. Forty flies were put into a choice chamber with two chambers. In one chamber there was a cotton ball soak with vinegar. The other chamber had nothing. After 20 minutes the number of flies were counted in both chambers. This was repeated four more times. Perform a chi-square analysis to determine if the difference between in the number of flies found in the two chambers is significant. Chi square calculation Is this value significant? Lab 13: Enzyme Lab An investigation was determining the amount of oxygen released from the decomposition of hydrogen peroxide with enzyme catalase. This investigation was conducted at two different temperatures. Graph the data presented in the data table. 1. Is the relationship between time and amount of oxygen released proportional? Explain the relationship. __________________________________________________________________________________________________ __________________________________________________________________________________________________ __________________________________________________________________________________________________ 2. During what time frame is the rate of the reaction the fastest? Explain why. __________________________________________________________________________________________________ __________________________________________________________________________________________________ 3. What is the effect of a decrease in temperature in this investigation? __________________________________________________________________________________________________ __________________________________________________________________________________________________ 4. Determine the rate of the reaction from 0-1 minute. 5. Draw in a line for what the reaction would be if done at 37oC. Justify your prediction. ____________________________________________________________________________________ ____________________________________________________________________________________

