Human Impact on Climate and Weather lab
advertisement
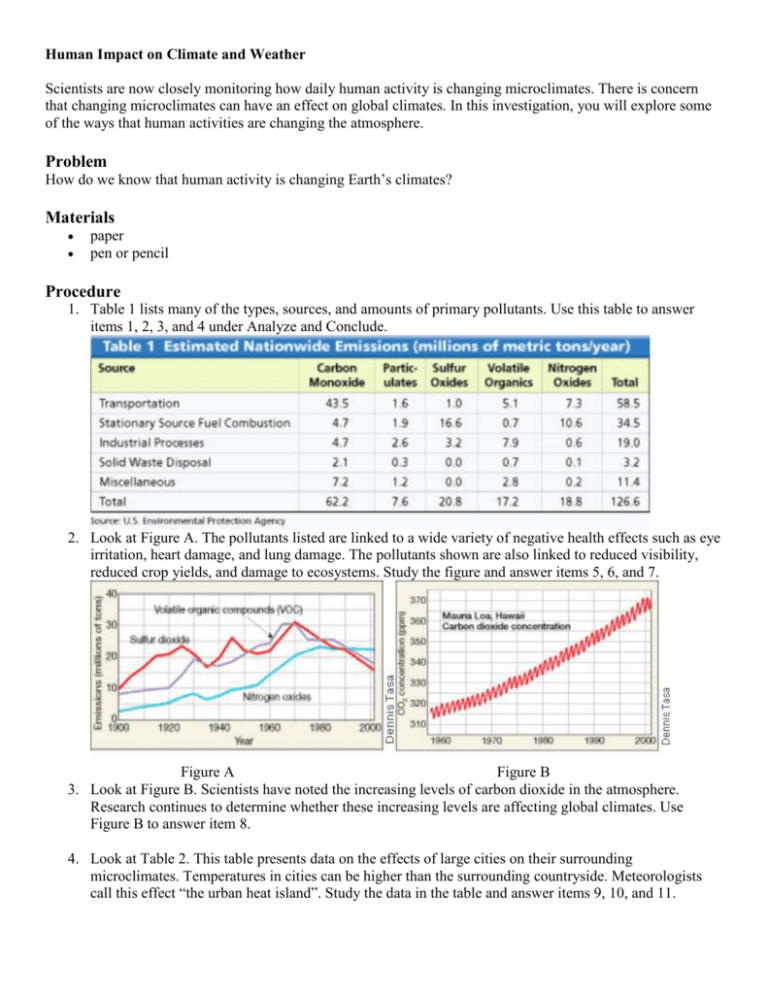
Human Impact on Climate and Weather Scientists are now closely monitoring how daily human activity is changing microclimates. There is concern that changing microclimates can have an effect on global climates. In this investigation, you will explore some of the ways that human activities are changing the atmosphere. Problem How do we know that human activity is changing Earth’s climates? Materials paper pen or pencil Procedure 1. Table 1 lists many of the types, sources, and amounts of primary pollutants. Use this table to answer items 1, 2, 3, and 4 under Analyze and Conclude. 2. Look at Figure A. The pollutants listed are linked to a wide variety of negative health effects such as eye irritation, heart damage, and lung damage. The pollutants shown are also linked to reduced visibility, reduced crop yields, and damage to ecosystems. Study the figure and answer items 5, 6, and 7. Figure A Figure B 3. Look at Figure B. Scientists have noted the increasing levels of carbon dioxide in the atmosphere. Research continues to determine whether these increasing levels are affecting global climates. Use Figure B to answer item 8. 4. Look at Table 2. This table presents data on the effects of large cities on their surrounding microclimates. Temperatures in cities can be higher than the surrounding countryside. Meteorologists call this effect “the urban heat island”. Study the data in the table and answer items 9, 10, and 11. Analyze and Conclude 1. Interpreting Data: What is the leading source (by weight) of primary pollutants? How many metric tons of this pollutant are added to the atmosphere each year? 2. Interpreting Data: Which of the following is the most abundant primary pollutant? a. carbon monoxide b. sulfur oxides 3. Calculating: Your answer for item 2 is what percentage of all primary pollutants? a. 25% b. 50% c. 75% 4. Calculating: What is the approximate total weight (in million metric tons) of all primary pollutants added to the atmosphere? 5. Interpreting Data: Describe the trend you see in the data for atmospheric pollutants prior to 1970. 6. Interpreting Data: Describe the trend you see in the data for atmospheric pollutants since 1970. 7. Inferring: Suggest a reason for the changing trend. 8. Calculating: What has been the approximate percentage increase in atmospheric carbon dioxide near Mauna Loa since 1958? 9. Interpreting Data: Compared to rural areas, which factors are increased by urbanization? Which factors are decreased? 10. Interpreting Data: Of all of the factors shown, which shows the greatest increase due to urbanization? 11. Predicting: Suggest a possible reason for each of the following effects on the weather that is influenced by a city. a. increased frequency of thunderstorms b. lower wind speed c. increased precipitation
