Supplemental Content
advertisement
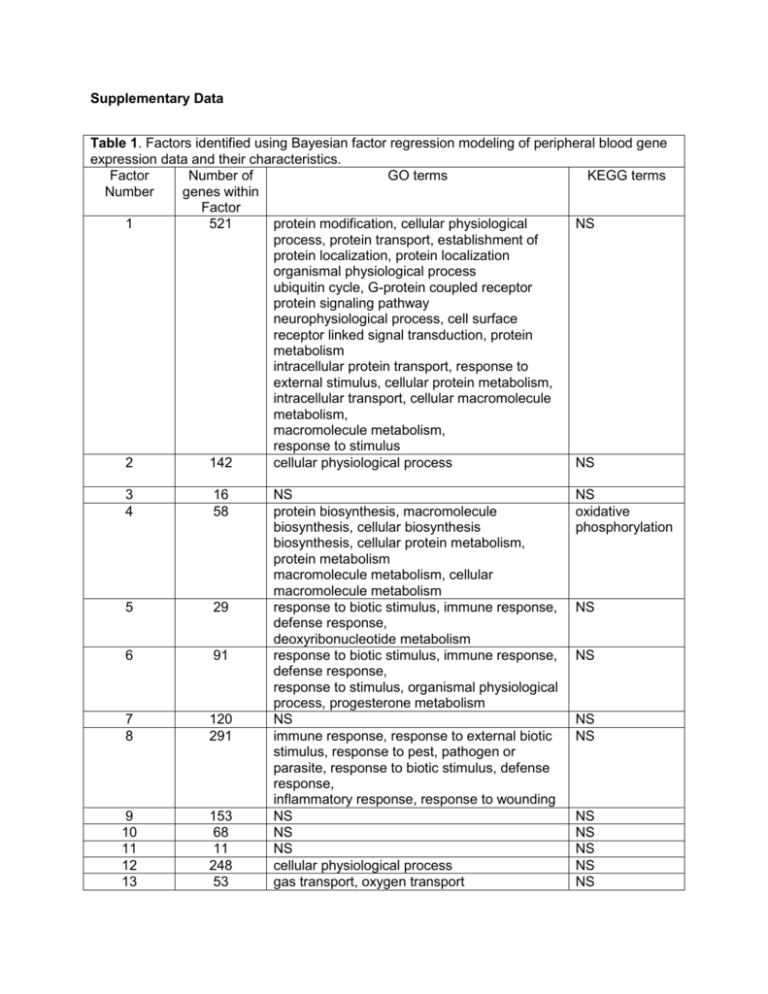
Supplementary Data Table 1. Factors identified using Bayesian factor regression modeling of peripheral blood gene expression data and their characteristics. Factor Number of GO terms KEGG terms Number genes within Factor 1 521 protein modification, cellular physiological NS process, protein transport, establishment of protein localization, protein localization organismal physiological process ubiquitin cycle, G-protein coupled receptor protein signaling pathway neurophysiological process, cell surface receptor linked signal transduction, protein metabolism intracellular protein transport, response to external stimulus, cellular protein metabolism, intracellular transport, cellular macromolecule metabolism, macromolecule metabolism, response to stimulus 2 142 cellular physiological process NS 3 4 16 58 5 29 6 91 7 8 120 291 9 10 11 12 13 153 68 11 248 53 NS protein biosynthesis, macromolecule biosynthesis, cellular biosynthesis biosynthesis, cellular protein metabolism, protein metabolism macromolecule metabolism, cellular macromolecule metabolism response to biotic stimulus, immune response, defense response, deoxyribonucleotide metabolism response to biotic stimulus, immune response, defense response, response to stimulus, organismal physiological process, progesterone metabolism NS immune response, response to external biotic stimulus, response to pest, pathogen or parasite, response to biotic stimulus, defense response, inflammatory response, response to wounding NS NS NS cellular physiological process gas transport, oxygen transport NS oxidative phosphorylation NS NS NS NS NS NS NS NS NS 14 62 15 16 99 32 blood coagulation, coagulation hemostasis, regulation of body fluids, platelet activation NS response to biotic stimulus NS NS Nicotinate and nicotinamide metabolism 17 115 NS NS 18 49 NS NS 19 52 NS NS 20 73 NS NS GO = Gene Ontology; KEGG = Kyoto Encyclopedia of Genes and Genomes; NS = no significantly associated terms/pathways (see Methods for significance level) Table 2. Validation of microarray based gene expression for Factor 14 probe sets with RT-PCR in HV2 cohort whole blood RNA. Gene name Taqman RTPCR Affymetrix microarray Correlation Correlation assay name probe set name coefficient p-value ITGA2B Hs01116228_m1 206494_s_at -0.94421 9.05E-26 TREML1 Hs00698316_m1 1555659_a_at -0.90545 3.04E-20 ITGA2B Hs01116228_m1 206493_at -0.90253 6.28E-20 MPL Hs00180489_m1 207550_at -0.89971 1.24E-19 MYL9 Hs00697086_m1 201058_s_at -0.89826 1.74E-19 PCSK6 Hs00159844_m1 207414_s_at -0.893 5.76E-19 ITGA2B Hs01116228_m1 216956_s_at -0.88851 1.53E-18 CLU Hs00971656_m1 208791_at -0.88747 1.90E-18 CLU Hs00971656_m1 208792_s_at -0.88153 6.40E-18 SPARC Hs00277762_m1 200665_s_at -0.87198 3.95E-17 ALOX12 Hs00167524_m1 207206_s_at -0.86138 2.53E-16 CMTM5 Hs00370784_m1 230942_at -0.85545 6.71E-16 SH3BGRL2 Hs00230283_m1 225354_s_at -0.85496 7.26E-16 CTDSPL Hs00505109_m1 201906_s_at -0.84553 3.12E-15 PPBP Hs00234077_m1 214146_s_at -0.84171 5.48E-15 PF4 Hs00236998_m1 206390_x_at -0.83419 1.59E-14 PBX1 Hs00295499_s1 212151_at -0.82951 3.01E-14 CTTN Hs01124225_m1 201059_at -0.82216 7.89E-14 SPARC Hs00277762_m1 212667_at -0.80984 3.60E-13 ITGB3 Hs01001469_m1 204628_s_at -0.79402 2.17E-12 TUBB1 Hs00258236_m1 230690_at -0.79401 2.17E-12 GNG11 Hs00914578_m1 204115_at -0.78661 4.78E-12 TGFB1I1 Hs00210887_m1 209651_at -0.76354 4.63E-11 PBX1 Hs00295499_s1 212148_at -0.76222 5.23E-11 GP1BB Hs00236857_m1 206655_s_at -0.74866 1.75E-10 TUBB1 Hs00258236_m1 208601_s_at -0.74411 2.59E-10 ELOVL7 Hs00405151_m1 227180_at -0.72899 8.91E-10 THBS1 Hs00962914_m1 201108_s_at -0.70496 5.42E-09 SELP Hs00356351_m1 206049_at -0.69728 9.30E-09 SLC24A3 Hs00221141_m1 57588_at -0.65927 1.07E-07 CALD1 Hs00921982_m1 212077_at -0.64826 2.04E-07 SLC24A3 Hs00221141_m1 219090_at -0.63347 4.65E-07 MYLK Hs00364926_m1 224823_at -0.6135 1.33E-06 ARHGAP6 Hs00241801_m1 206167_s_at -0.60772 1.77E-06 PRKAR2B Hs00176966_m1 203680_at -0.57731 7.45E-06 PDE5A Hs00903251_m1 227088_at -0.55683 1.81E-05 FSTL1 Hs00907496_m1 208782_at -0.53538 4.32E-05 TTC7B Hs00406077_m1 226152_at -0.52431 6.62E-05 GUCY1B3 Hs00168336_m1 203817_at -0.52258 7.07E-05 MMD Hs00948031_m1 203414_at -0.39744 0.003528 FRMD3 Hs00604157_m1 230645_at -0.21862 0.119455 SDPR Hs00190538_m1 222717_at -0.18796 0.182072 CPNE5 Hs00326218_m1 227189_at -0.07961 0.574802 CCDC90A Hs00254417_m1 227451_s_at -0.06118 0.666593 CDC14B Hs00269351_m1 221556_at -0.04119 0.771874 *coefficient and p-value correspond to Pearson correlation test between RMA normalized microarray expression for a given probe set and delta Ct (where higher values represent lower transcript abundance) for the corresponding RT-PCR assay. Table 3. Concordance of correlations with PFS between microarray and RTPCR based gene expression for Factor 14 genes in HV2 cohort Gene Affymetrix RT-PCR based Microarray based Name probe set ID Correlation coefficient* Correlation coefficient* CTDSPL 201906_s_at 0.34 -0.38 FSTL1 208782_at 0.18 -0.38 ITGA2B 216956_s_at 0.22 -0.37 TREML1 1555659_a_at 0.35 -0.35 SPARC 212667_at 0.23 -0.31 ITGA2B 206494_s_at 0.22 -0.30 ITGA2B 206493_at 0.22 -0.30 MPL 207550_at 0.30 -0.29 CTTN 201059_at 0.24 -0.29 CMTM5 230942_at 0.24 -0.29 SELP 206049_at 0.19 -0.28 CLU 208791_at 0.23 -0.27 GP1BB 206655_s_at 0.27 -0.27 ITGB3 204628_s_at 0.30 -0.26 TGFB1I1 209651_at 0.20 -0.25 ALOX12 207206_s_at 0.19 -0.24 PBX1 212151_at 0.26 -0.24 CPNE5 227189_at 0.33 -0.24 MYL9 201058_s_at 0.31 -0.24 CLU 208792_s_at 0.23 -0.22 PPBP 214146_s_at 0.24 -0.22 SH3BGRL2 225354_s_at 0.22 -0.20 PF4 206390_x_at 0.30 -0.20 THBS1 201108_s_at 0.13 -0.20 SLC24A3 57588_at 0.06 -0.20 PBX1 212148_at 0.26 -0.19 SPARC 200665_s_at 0.23 -0.18 GNG11 204115_at 0.24 -0.16 TUBB1 208601_s_at 0.16 -0.16 PCSK6 207414_s_at 0.28 -0.15 SLC24A3 219090_at 0.06 -0.15 PDE5A 227088_at 0.20 -0.14 GUCY1B3 203817_at 0.17 -0.12 CALD1 212077_at 0.13 -0.11 PRKAR2B 203680_at 0.23 -0.10 TTC7B 226152_at 0.00 -0.10 ARHGAP6 206167_s_at 0.20 -0.10 TUBB1 230690_at 0.16 -0.09 ELOVL7 227180_at 0.20 -0.08 MYLK 224823_at 0.22 -0.05 MMD 203414_at 0.21 -0.05 SDPR 222717_at 0.21 -0.05 FRMD3 230645_at -0.12 0.00 CDC14B 221556_at 0.13 0.18 CCDC90A 227451_s_at -0.14 0.28 *Correlation coefficients represent Pearson correlations between gene expression based on microarray or RTPCR for Factor 14 transcripts and post-aspirin platelet function score (PFS) in HV2 cohort. Table 4. Comparison of platelet and megakaryocyte genes with Factor 14 Gene set description* GSEA NES GSEA P-value GSEA Q-value** Reference Factor 14 genes (reference) Number Number of of overlapping features genes with Factor 14*** 62 62 2.23 <0.0001 <0.0001 N/A Platelet genes (A) 248 25 2.18 <0.0001 <0.0001 1 Platelets specific genes (B) 36 12 2.12 <0.0001 0.001 2 Megakaryocytes genes (C) 261 20 2.06 <0.0001 0.001 3 Platelet genes (D) 196 14 1.97 <0.0001 0.008 4 Platelet proteins (E) 99 31 1.84 <0.0001 0.01 5 Platelet genes (F) 36 6 1.73 0.004 0.02 6 GSEA = Gene Set Enrichment Analysis (GSEA); NES = Normalized enrichment score; *The gene lists were as follows: A) the abundant platelet transcripts identified by RNA-sequencing1; B) platelet-specific transcripts identified in platelets of sickle cell disease patients or controls2; C) megakaryocyte-specific genes3; D) abundant platelet genes identified in platelets of patients with systemic lupus or controls4; or E) platelet proteins from healthy donors5; F) the top 50 genes identified in purified platelets from healthy volunteers6; **refers to false discovery rate q-value;***p ≤ 0.001 for all overlaps. Table 5. Comparison of Factor 14 genes with non-platelet derived peripheral blood cell-type genes*. Gene set description* Number of Number of GSEA NES GSEA GSEA features overlapping P-value** Q-value*** genes with Factor 14* CD4+ Th lymphocytes 36 0 -0.7 0.7 0.7 CD8+ Tc lymphocytes 4 0 0.7 0.7 0.8 CD14+ Monocytes 164 0 0.6 0.8 0.9 CD19+ B lymphocytes 53 0.5 1.0 0.9 CD56+ NK cells 605 0 1.4 0.2 0.2 CD66+ granulocytes 257 0 1.7 0.03 0.03 Erythroblasts 38 0 1.3 0.2 0.2 *Cell-type specific gene lists were obtained from Watkins et al3; Abbreviations and footnotes are per Table 2. Table 6. Baseline characteristics in CATHGEN cohorts and their association with Factor 14 levels Variable Case:Control Observational cohort (n P-value for Cohort (n = = 190) association with 397) Factor 14* Age (years, median, 65 [57 -73] 56 [47 -67] 0.15 [IQR]) Hypertension (%) 70.3% 70.5% 0.23 CAD 26% 78% 0.47 Diabetes (%) 34.3% 23.2% 0.14 RACE (%) White 74.3% 66.8% Reference African-American 21.7% 26.8% 2.13e-06 Other 4.0% 6.3% 0.53 Female (%) 32.2% 41.1% 7.37e-06 Smoking history (%) 47.9% 53.7% 0.06 Hyperlipidemia (%) 61.0% 61.6% 0.37 *The combined Case:Control and Observational cohorts were used to test for associations with Factor 14 levels, while controlling for cohort using linear regression. Table 7. Factor 14 individual probe sets are associated with death or myocardial infarction in two independent datasets. Probe set ID Gene name Odds Ratio* Odds Ratio Hazard Hazard Ratio p-value Ratio* p-value Factor 14 n/a 0.028036541 1.21 1.47 0.001454 Factor 14 individual probe set associations 201058_s_at MYL9 1.30 0.00400748 1.75 7.65E-06 206494_s_at ITGA2B 1.37 0.00351754 1.83 1.88E-05 216956_s_at ITGA2B 1.52 0.000531982 1.82 3.09E-05 230942_at CMTM5 0.066298986 1.31 2.52 3.50E-05 1555659_a_at TREML1 1.36 0.010689841 1.89 5.63E-05 212573_at ENDOD1 1.94 4.95E-05 2.10 0.000188 212148_at PBX1 1.46 2.45E-06 1.47 0.0002 226188_at LGALSL 1.38 0.071992059 2.62 0.000206 212151_at PBX1 1.65 1.48E-05 1.73 0.000281 206493_at ITGA2B 1.46 0.002887947 1.83 0.000351 210986_s_at TPM1 1.87 1.45E-05 1.83 0.000422 57588_at SLC24A3 0.440525089 1.15 2.19 0.000472 209651_at TGFB1I1 1.32 0.015158949 1.63 0.000616 203819_s_at IGF2BP3 1.45 0.033315085 1.86 0.000619 206049_at SELP 1.46 0.021063226 2.01 0.000636 1552773_at CLEC4D 1.48 0.00175683 1.74 0.000708 226152_at TTC7B 1.43 0.029162426 2.06 0.000931 204628_s_at ITGB3 1.41 0.059389555 1.81 0.00112 208791_at CLU 1.56 0.002006075 1.84 0.001166 206655_s_at GP1BB 0.043694557 1.32 1.69 0.001235 210387_at HIST1H2BG 1.74 0.000124728 1.98 0.001269 201108_s_at THBS1 1.39 0.02328534 1.87 0.001633 208792_s_at CLU 1.51 0.003791609 1.80 0.001869 219090_at SLC24A3 1.16 0.373804241 2.01 0.001907 225974_at 207206_s_at 229778_at 215779_s_at 37966_at 225354_s_at 212667_at 207414_s_at 235331_x_at 200665_s_at 207808_s_at 212077_at 201906_s_at 241133_at 206390_x_at 211026_s_at 230645_at 206110_at 208601_s_at 203680_at 227180_at 214146_s_at 227189_at 208782_at 1560262_at 201059_at 220496_at 212651_at 204115_at 206167_s_at TMEM64 ALOX12 C12orf39 HIST1H2BG PARVB SH3BGRL2 SPARC PCSK6 PCGF5 SPARC PROS1 CALD1 CTDSPL TRBV27 PF4 MGLL FRMD3 HIST1H3H TUBB1 PRKAR2B ELOVL7 PPBP CPNE5 FSTL1 LRRC32 CTTN CLEC1B RHOBTB1 GNG11 ARHGAP6 0.59 1.21 1.39 1.68 1.04 1.34 1.25 1.23 1.93 1.44 1.45 1.11 1.30 1.28 1.13 1.16 1.85 1.72 1.16 1.43 1.25 1.55 0.71 1.28 1.24 1.16 1.50 1.32 1.41 1.14 0.008235562 0.138154505 0.004259803 0.002837678 0.771921449 0.049135136 0.167170138 0.150039721 5.27E-06 0.008859476 0.018336331 0.338890694 0.11440241 0.019888406 0.398156787 0.327461963 0.000131807 3.26E-05 0.201369942 0.005278287 0.070697319 0.000423437 0.079532372 0.086692126 0.155422462 0.299273772 0.002955397 0.08218736 0.004779687 0.422952376 0.41 1.74 1.58 1.81 1.81 1.79 1.78 1.72 1.42 1.72 1.58 1.52 1.90 1.52 1.85 1.85 1.79 1.57 1.50 1.54 1.49 1.83 1.63 1.53 1.55 1.53 1.43 1.43 1.45 1.36 0.002877 0.003564 0.005073 0.005208 0.005396 0.00551 0.005604 0.006252 0.006562 0.006808 0.006933 0.006972 0.007299 0.011429 0.0117 0.012801 0.014483 0.018138 0.01831 0.025644 0.032551 0.037707 0.03795 0.039651 0.050918 0.057153 0.079647 0.096564 0.118268 0.151355 227088_at PDE5A 1.35 0.046937627 1.37 0.151501 203817_at GUCY1B3 1.28 0.098280545 1.35 0.160362 207550_at MPL 1.05 0.717720328 1.28 0.210728 1553842_at BEND2 1.42 0.079659139 1.33 0.233 212813_at JAM3 0.97 0.872083306 1.34 0.240894 230690_at TUBB1 1.09 0.589122948 1.31 0.265404 207156_at HIST1H2AG 0.004128653 1.54 1.27 0.303256 225166_at ARHGAP18 1.53 0.034773026 1.30 0.338505 224823_at MYLK 1.24 0.099105304 1.21 0.357528 227451_s_at CCDC90A 1.07 0.751398281 0.76 0.381367 228708_at RAB27B 1.21 0.257379973 0.84 0.546707 207815_at PF4V1 1.07 0.397575492 1.07 0.581265 221556_at CDC14B 0.78 0.197214947 0.86 0.60266 222717_at SDPR 1.08 0.545883997 1.10 0.679631 206272_at RAB4A 0.020878373 1.54 0.91 0.803266 214974_x_at CXCL5 0.88 0.201323204 0.97 0.867518 205442_at MFAP3L 0.90 0.409405359 1.01 0.968416 203414_at MMD 1.19 0.292053865 1.01 0.985414 *Individual Factor 14 probe sets were associated with death or myocardial infarction in the case control and observational cohorts, yielding odds ratios and hazards ratios, respectively. For each probe set analyses were adjusted for log(platelet count), race, and sex. Table 8. Net Reclassification Table for combined CATHGEN cohorts Factor 14 10% 10-20% >20% 10% 10 4 0 10-20% 4 55 6 >20% 0 14 474 Net Reclassification Index ITGA2B 10% 10-20% >20% 10% 8 5 1 10-20% 13 42 10 >20% 1 24 463 Net Reclassification Index % Reclassified 29 15 3 4.6% (p = 0 007) % Reclassified 43 35 5 7.5% (p = 0.002) Figure 1. Concordance between RTPCR vs. microarray correlations with platelet function score (PFS). The correlation (Ct vs. PFS) of RT-PCR based gene expression of Factor 14 genes with PFS in HV2 whole blood RNA (x-axis) is plotted against the microarray based correlation (probe set expression vs. PFS) for the same genes (y-axis). For the vast majority of Factor 14 genes there is concordance such that the correlations using RT-PCR with PFS are in the same direction with microarray based correlations. Many RT-PCR correlations are stronger than microarray based correlations (i.e. point is above the line of unity). Figure 2. The genes represented by Factor 14 are tightly co-expressed before and after the administration of aspirin. The set of Factor 14 transcripts in the HV1, post-aspirin dataset were ordered based on their correlation with the first principal component of their expression values (see Methods for more details) and visualized using a heatmap (panel A). The order of the probe sets was then used to generate a heatmap of the pre-aspirin set of transcripts from the same individuals (panel B). Within an individual (columns) there is a similar pattern of gene expression (i.e., predominatnly under or over expressed) both before and after aspirin exposure. Therefore, aspirin exposure is unrelated to the coordinated expression of this set of transcripts. Supplemental References to Online Tables 1. Rowley JW, Oler A, Tolley ND, et al. Genome wide RNA-seq analysis of human and mouse platelet transcriptomes. Blood 2011. 2. Raghavachari N, Xu X, Harris A, et al. Amplified expression profiling of platelet transcriptome reveals changes in arginine metabolic pathways in patients with sickle cell disease. Circulation 2007;115:1551-62. 3. Watkins NA, Gusnanto A, de Bono B, et al. A HaemAtlas: characterizing gene expression in differentiated human blood cells. Blood 2009;113:e1-e9. 4. Lood C, Amisten S, Gullstrand B, et al. Platelet transcriptional profile and protein expression in patients with systemic lupus erythematosus: up-regulation of the type I interferon system is strongly associated with vascular disease. Blood 2010. 5. Krishnan S, Gaspari M, Corte AD, et al. OFFgel-based multidimensional LC-MS/MS approach to the cataloguing of the human platelet proteome for an interactomic profile. Electrophoresis 2011;32:686-95. 6. Gnatenko DV, Dunn JJ, McCorkle SR, Weissmann D, Perrotta PL, Bahou WF. Transcript profiling of human platelets using microarray and serial analysis of gene expression. Blood 2003;101:2285-93.


