Ideal gas equation
advertisement
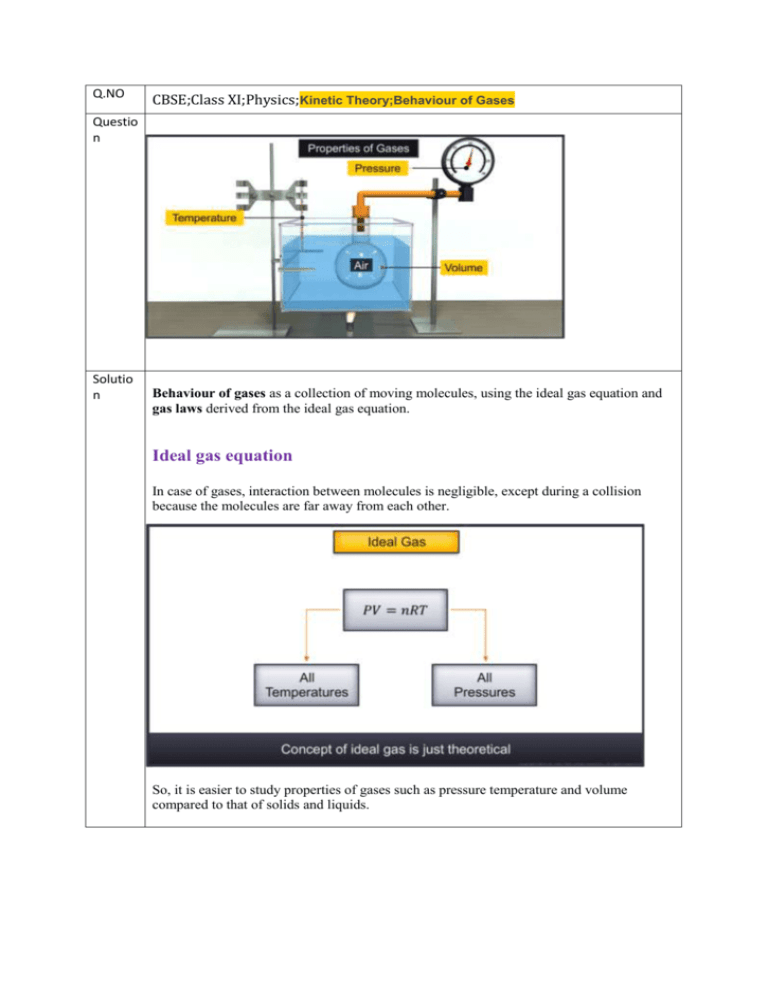
Q.NO CBSE;Class XI;Physics;Kinetic Theory;Behaviour of Gases Questio n Solutio n Behaviour of gases as a collection of moving molecules, using the ideal gas equation and gas laws derived from the ideal gas equation. Ideal gas equation In case of gases, interaction between molecules is negligible, except during a collision because the molecules are far away from each other. So, it is easier to study properties of gases such as pressure temperature and volume compared to that of solids and liquids. Gases at low pressure and high temperature satisfy a simple relation, PV = kT − − − − − − − (i), where P is the pressure, V is the volume, T is the temperature in Kelvin scale and K is the proportionality constant. For a given sample of gas, K is constant and can be written as the following k = NkB , Where “N” is the number of molecules in the given sample. From observation during various experiments, it is clear that the value of k B is constant for all gases and is called the Boltzmann Constant. Its value is 1.38 × 10− 23 joules /kelvin. Substituting the value of k = NkB in Equation (i) PV = NkBT − − − − − −(ii) We know that one mole of gas contains an Avogadro number of molecules denoted by NA. N = n × NA , where “n” is the number of moles of the gas present. , Substituting the value of N in the equation P V = N k B T we get as the following P V = n × NA × k B T P V = n NA k B T − − − − − −(iii) Where,NA × k B = R, R is called the universal gas constant. The value of R is 8.314 joules per mole per kelvin. This value is constant for a given system of units. Equation (iii) is also called the ideal gas equation. A gas that satisfies the ideal gas equation at all temperatures and pressures is called as an ideal gas. Note: The concept of an ideal gas is merely a theoretical concept. In practice, there is no ideal gas. If we plot a graph by taking pressure on the x-axis and P V by n T on the y-axis, the graph is a straight line parallel to the x-axis for an ideal gas. That is, the value P V by n T is constant even when pressure changes. As shown in the following graph. The behaviour of a real gas at three different temperatures is shown in the figure. From the graph, it is clear that all the curves approach the behaviour of an ideal gas at low pressure and high temperature. This is because at high temperatures and low pressures, the molecules of the gas are far apart and interaction between the molecules is negligible. From the ideal gas equation we can say that at constant temperature and pressure equal volumes of different gases contain an equal number of molecules. V That means for an Ideal gas, is constant V n. n This is called Avogadro’s Law. Let V1 and V2 be the volumes of a gas and n1 and n2 be the number of moles of the gas. If they are at the same pressure and temperature, according to Avogadro’s Law 𝑉1 𝑛1 = 𝑉2 , 𝑛2 One mole of any gas can occupy a volume of 22.4 litres at STP and it contains Avogadro’s number of molecules, that is, 6 point 0 2 into 10 raised to power 23 molecules. The mass of 22.4 litres of any gas at STP is equal to its molecular weight. Thus, the number of moles in a gas is calculated by using the following formula, Number of moles (n) = weight of the gas in grams / molecular weight in grams. As the mass of a given gas (M) increases, the number of molecules (N) also increases. i.e., M N. A mass of one mole of a gas is called molar mass denoted by M 0. It contains an Avogadro number of molecules denoted by N A. M / M 0 = N / N A. Boyle’s Law If the number of moles and temperature is constant in the ideal gas equation P V = Constant. For a given mass of gas at a constant temperature, pressure is inversely proportional to its volume. This is called Boyle’s Law. According to Boyle’s Law the graph between pressures versus volume is shown in the figure. Boyle’s Law is also satisfied at high temperatures and low pressures. Charles’ Law If the number of moles and pressure of a given gas are kept constant then the ideal gas equation can be modified as volume of a gas is directly proportional to its absolute temperature. V That is, V T T = Constant This is called Charles’ Law. If we plot a graph by taking volume on the x-axis and temperature on the y-axis at three different constant pressures, the graphs are as shown in the figure. In this case too, the graph is well-fitted at high temperature, that is, a straight line, but it is a curved line at low temperatures. This is according to Charles’ Law. Dalton’s Law of Partial Pressures Consider a mixture of non-interactive gases in a container at a constant temperature (T), pressure (P) and volume (V). Let n1 be the number of moles of the first gas n2 the number of moles of the second gas and n3 the number of moles of the third gas etc. Then the equation of state for the mixture of the gas as the following P V = (n1 + n2 + n3 … )RT into R T − − − − − −(iv) But if we apply the ideal gas equation to the individual gases, we get the following equation P1 V = n1 RT P2 V = n2 RT P3 V = n3 RT …. P1 V P2 V P3 V n1 = , n2 = , n3 = RT RT RT On substituting the values of n1, n2, n3, … in equation (iv) P V We get P V = ( R1 T + P2 V RT + P3 V RT … ) RT On simplification, we get P = P1 + P2 + P3 … That is, the total pressure of the mixture of gases is equal to the sum of individual partial pressures exerted by all the gases. This is called Dalton’s Law of Partial Pressures.
