4th Grade NWEA - Naaba Ani Home
advertisement
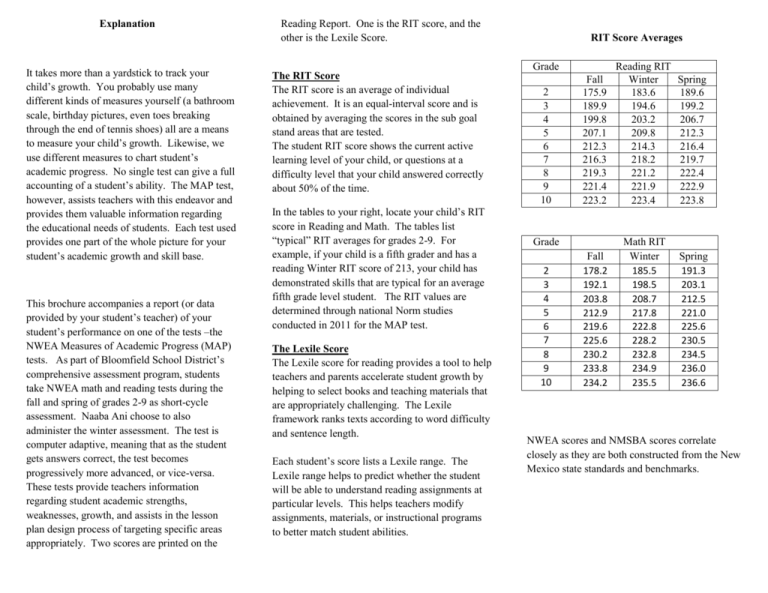
Explanation It takes more than a yardstick to track your child’s growth. You probably use many different kinds of measures yourself (a bathroom scale, birthday pictures, even toes breaking through the end of tennis shoes) all are a means to measure your child’s growth. Likewise, we use different measures to chart student’s academic progress. No single test can give a full accounting of a student’s ability. The MAP test, however, assists teachers with this endeavor and provides them valuable information regarding the educational needs of students. Each test used provides one part of the whole picture for your student’s academic growth and skill base. This brochure accompanies a report (or data provided by your student’s teacher) of your student’s performance on one of the tests –the NWEA Measures of Academic Progress (MAP) tests. As part of Bloomfield School District’s comprehensive assessment program, students take NWEA math and reading tests during the fall and spring of grades 2-9 as short-cycle assessment. Naaba Ani choose to also administer the winter assessment. The test is computer adaptive, meaning that as the student gets answers correct, the test becomes progressively more advanced, or vice-versa. These tests provide teachers information regarding student academic strengths, weaknesses, growth, and assists in the lesson plan design process of targeting specific areas appropriately. Two scores are printed on the Reading Report. One is the RIT score, and the other is the Lexile Score. The RIT Score The RIT score is an average of individual achievement. It is an equal-interval score and is obtained by averaging the scores in the sub goal stand areas that are tested. The student RIT score shows the current active learning level of your child, or questions at a difficulty level that your child answered correctly about 50% of the time. In the tables to your right, locate your child’s RIT score in Reading and Math. The tables list “typical” RIT averages for grades 2-9. For example, if your child is a fifth grader and has a reading Winter RIT score of 213, your child has demonstrated skills that are typical for an average fifth grade level student. The RIT values are determined through national Norm studies conducted in 2011 for the MAP test. The Lexile Score The Lexile score for reading provides a tool to help teachers and parents accelerate student growth by helping to select books and teaching materials that are appropriately challenging. The Lexile framework ranks texts according to word difficulty and sentence length. Each student’s score lists a Lexile range. The Lexile range helps to predict whether the student will be able to understand reading assignments at particular levels. This helps teachers modify assignments, materials, or instructional programs to better match student abilities. RIT Score Averages Grade 2 3 4 5 6 7 8 9 10 Fall 175.9 189.9 199.8 207.1 212.3 216.3 219.3 221.4 223.2 Reading RIT Winter 183.6 194.6 203.2 209.8 214.3 218.2 221.2 221.9 223.4 Spring 189.6 199.2 206.7 212.3 216.4 219.7 222.4 222.9 223.8 Fall 178.2 192.1 203.8 212.9 219.6 225.6 230.2 233.8 234.2 Math RIT Winter 185.5 198.5 208.7 217.8 222.8 228.2 232.8 234.9 235.5 Spring 191.3 203.1 212.5 221.0 225.6 230.5 234.5 236.0 236.6 Grade 2 3 4 5 6 7 8 9 10 NWEA scores and NMSBA scores correlate closely as they are both constructed from the New Mexico state standards and benchmarks. Naaba Ani Elementary Fall 2014 Score 2014-2015 Student Performance Naaba Ani Elementary Winter 2015 Score 2014-2015 Student Performance Math Grade 4 Math Grade 4 Beginning Considerably Below Grade Level Beginning Considerably Below Grade Level 55% xx% Nearing Proficient Nearing Grade Level Nearing Proficient Nearing Grade Level 39% xx% Naaba Ani More Data To Come This Winter Elementary Proficient At or Above Grade Level Proficient At or Above Grade Level 6% xx% Reading Grade 4 Reading Grade 4 Beginning Considerably Below Grade Level Beginning Considerably Below Grade Level 24% xx% Nearing Proficient Nearing Grade Level Nearing Proficient Nearing Grade Level 62% xx% Proficient At or Above Grade Level Proficient At or Above Grade Level 14% xx% Grade 4 2014-2015 NWEA School-wide Data Brochure 2011 Norms


