David Maher - Rice University
advertisement
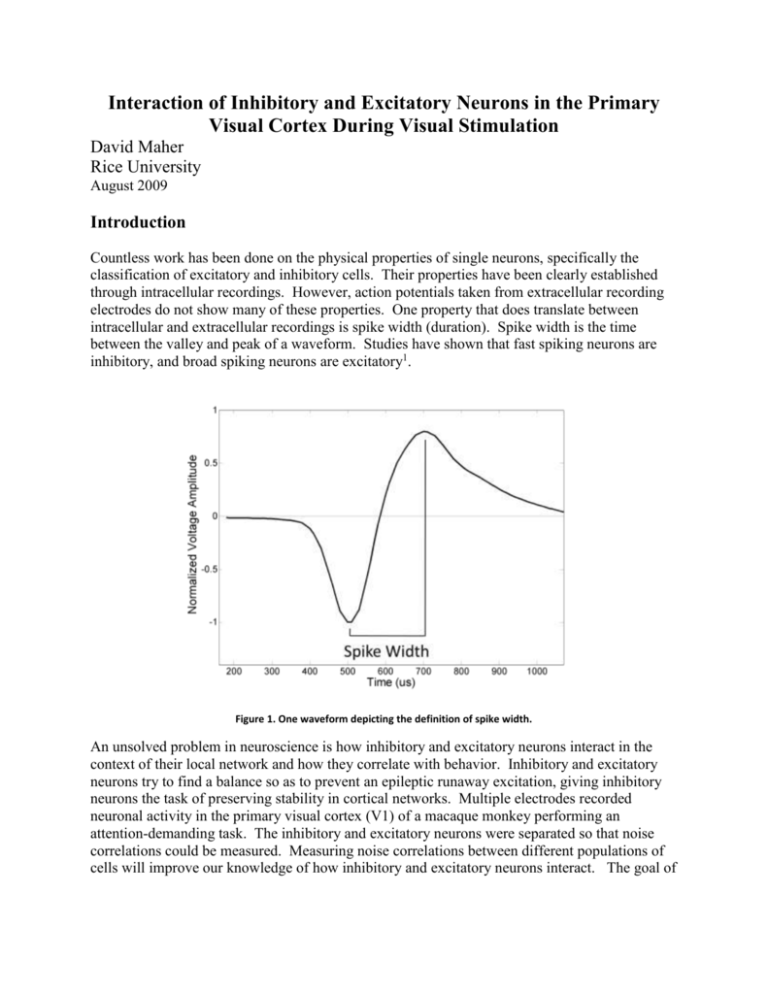
Interaction of Inhibitory and Excitatory Neurons in the Primary Visual Cortex During Visual Stimulation David Maher Rice University August 2009 Introduction Countless work has been done on the physical properties of single neurons, specifically the classification of excitatory and inhibitory cells. Their properties have been clearly established through intracellular recordings. However, action potentials taken from extracellular recording electrodes do not show many of these properties. One property that does translate between intracellular and extracellular recordings is spike width (duration). Spike width is the time between the valley and peak of a waveform. Studies have shown that fast spiking neurons are inhibitory, and broad spiking neurons are excitatory1. Figure 1. One waveform depicting the definition of spike width. An unsolved problem in neuroscience is how inhibitory and excitatory neurons interact in the context of their local network and how they correlate with behavior. Inhibitory and excitatory neurons try to find a balance so as to prevent an epileptic runaway excitation, giving inhibitory neurons the task of preserving stability in cortical networks. Multiple electrodes recorded neuronal activity in the primary visual cortex (V1) of a macaque monkey performing an attention-demanding task. The inhibitory and excitatory neurons were separated so that noise correlations could be measured. Measuring noise correlations between different populations of cells will improve our knowledge of how inhibitory and excitatory neurons interact. The goal of this study is to understand how behavior affects the inter-workings of the neural network. The 2 papers being used for comparison in this study are papers by Mitchell1 and Chen2. Figure 2. A retinotopical map of the visual cortices of a macaque brain (right side view). V1: the primary visual cortex 3 Methods 14 recording sessions of extracellular multiple-electrode recordings were taken in an awake macaque’s primary visual cortex (V1). 218 neurons were analyzed of which 194 were classified into inhibitory and excitatory cells. For the macaque’s task, a target stimulus of a picture of a sine-wave grating at either 45° or 135° was presented for 300 ms. Then, after 300 ms, a test stimulus of a picture of a sine-wave grating 0°,5°, or 10° different from target stimulus was presented for 300 ms. The task of the macaque was to lift the bar when the target and test stimuli were the same angle. Figure 3. Depiction of the 2 different paths of the experiment for the macaque monkey. Analysis Separating Inhibitory and Excitatory Neurons Between 50 and 200 thousand spikes are recorded from each channel of the electrode during one recording session. A lot of these spikes are made of mostly noise that must be cleaned. The rest of the spikes from the multiple-electrode recordings were sorted by principal component analysis using the program Offline Sorter. The average of all spikes for one cell produced the mean neuronal waveform. Almost all of the neurons could be characterized by high or low signal to noise. The problem of with the comparison to the Mitchell and Chen papers is that they focused on clean, high signal to noise waveforms. Thus, our numbers are slightly skewed. Also, since many of the waveforms used in this study are low signal to noise waveforms, there may be some error in the classification of the waveforms due to noise. For all following plots, the height of the waveforms has been normalized to assist in the visual comparison of spike widths. Two Mean Neuronal Waveforms A B B B Figure 4. Graphs demonstrating difference in spike width for 2 inhibitory and excitatory cells with (A) high signal to noise and (B) low signal to noise. In both graphs, the 2 cells were taken from the same trial. It helps to compare what the average inhibitory and excitatory neurons look like. The total average of all inhibitory and excitatory cells was taken by finding the average value of all the mean neuronal waveforms. A B B B Figure 5. (A) 30 mean neuronal waveforms for comparison. (B) Average waveforms of all inhibitory and excitatory cells The ratio of the waveforms is defined as peak divided by valley. In this study, inhibitory cell waveforms had a mean ratio of 0.21. Excitatory cell waveforms had a mean ratio of 0.45. Previous studies state that inhibitory cells have a higher ratio than excitatory cells1,2, which may show a flaw in the data used in this study. However, both of the previous studies used only high signal to noise waveforms, whereas this study used both. Essentially, the mean ratios may be dependent upon how many waveforms were high or low signal to noise. The two previous works have agreed upon a spike width of 200 µs as a good separation point for inhibitory and excitatory neurons. These studies presume that inhibitory neurons have a spike width between 100-200 µs and excitatory cells 200-500 µs1,2. These numbers were determined by plotting a histogram of number of cells vs. spike width and finding a logical separation point in the middle of the bimodal distribution. Distribution of Spike Widths 50 Inhibitory Excitatory Number of Cells 40 30 20 10 0 50 100 150 200 250 300 350 400 450 500 Spike Width (us) Figure 6. The bimodal distribution of spike widths was clearly split into inhibitory and excitatory cells As proof that the data was truly split into inhibitory and excitatory cells, the distribution of spike widths is significantly bimodal. However, the criteria for classification were slightly altered for this study. The separation point was set somewhere between 175-190 µs because the number of waveforms bottomed out in this section. For better separation, cells with spikes between 175190 µs were ignored since it was too hard to determine their correct classification. This only eliminated 3 cells. Overall, there were 94 inhibitory cells and 100 excitatory cells using the spike width sorting criteria. Stimuli Effects The immediate increase in firing rate (number of spikes/s) occurs as expected when target and test stimuli are presented. The data fits with the results from the Chen study that firing rate decreases with a harder task2. Responding to the test stimulus is much harder than simply looking at the target stimulus. However, the data refutes the Mitchell study which states that firing rates of inhibitory cells should be significantly higher than the firing rates of excitatory cells1. Mitchell proposes that inhibitory cells should have roughly twice the firing rate of excitatory cells during stimulation. Inhibitory cells should also have a higher spontaneous firing rate than excitatory cells. There is also no difference in spontaneous activity (region between stimuli times) between inhibitory and excitatory cells in this study. PSTH Excitatory PSTH Inhibitory 20 A B 9 B B Spikes/s Spikes/s 15 6 10 5 0 100 200 300 400 500 Time (ms) 600 700 800 900 1000 3 0 100 200 300 400 500 600 700 800 900 1000 Time (ms) Figure 7. PSTH – Post-stimulus time histogram: Firing rates (number of spikes/s) for every millisecond of the trial. Average PSTH for (A) Excitatory and (B) Inhibitory neurons. Correlations The correlation coefficient is determined by determining how the firing of one cell’s action potential affects another cell. The correlation coefficient between two cells determines how the action of one cell affects the action of another. Correlations can be used to create broad neural network structures depicting how all cells interact with each other. Inhibitory-Excitatory Correlations ie-green ; ee-red ; ii-blue 1 0.8 A 0.6 B Test Correlation Coefficient Test Correlation Coefficient 1 0.4 0.2 0 B 0.6 B 0.4 0.2 0 -0.2 -0.2 -0.4 -0.4 0.8 -0.2 0 0.2 0.4 0.6 0.8 -0.4 -0.4 1 -0.2 Excitatory-Excitatory Correlations C 0.8 Test Correlation Coefficient Test Correlation Coefficient 0.4 0.6 0.8 1 0.8 1 1 0.6 B 0.4 0.2 0 D 0.6 B 0.4 0.2 0 -0.2 -0.2 -0.4 -0.4 0.2 Inhibitory-Inhibitory Correlations 1 0.8 0 Target Correlation Coefficient Target Correlation Coefficient -0.2 0 0.2 0.4 0.6 Target Correlation Coefficient 0.8 1 -0.4 -0.4 -0.2 0 0.2 0.4 0.6 Target Correlation Coefficient Figure 8. Green: Inhibitory-Excitatory correlations; Red: Excitatory-Excitatory correlations; Blue: Inhibitory-Inhibitory correlations. (A) All, (B) Inhibitory-Excitatory, (C) Excitatory-Excitatory, (D) Inhibitory-Inhibitory correlations with best fit lines. Inhibitory-Excitatory Excitatory-Excitatory Inhibitory-Inhibitory Mean Test Correlation Mean Target Correlation 0.1421 0.1535 0.1414 0.1672 0.0863 0.1104 Test:Target Ratio 0.9283 0.8457 0 .7817 Table 1. Mean correlations for Test and Target stimuli and ratio of mean Test:mean Target stimuli. The target stimulus correlations are higher than the test stimulus correlations. This is probably because the test stimulus is the harder task. The important thing is that it does show a change in the interaction between inhibitory and excitatory cells with task. The inhibitory-inhibitory correlations are much lower because inhibitory neurons mostly serve to inhibit excitatory neurons whereas excitatory neurons excite other excitatory neurons. Thus, inhibitory neurons only work together when they are trying to inhibit excitatory neurons. References 1. Mitchell, J.F., Sundberg, K.A., & Reynolds, J.H. (2007). Differential AttentionDependent Response Modulation across Cell Classes in Macaque Visual Area V4. Neuron, 55, 131-141. 2. Chen, Y., Martinez-Conde, S., Macknik, S.L. (2008). Task Difficulty Modulates the Activity of Specific Neuronal Populations in Primary Visual Cortex. Nature Neuroscience, 11 (8), 974-982. 3. Mikami, A. Possible neurophysiological basis of visual, auditory and somatosensory images seen in the sharmanism. In: Irimoto, Yamada (eds.), Sharmanism in the northern world. Hokkaidou Univ. Press, pp. 287-295, 1997.

