file
advertisement
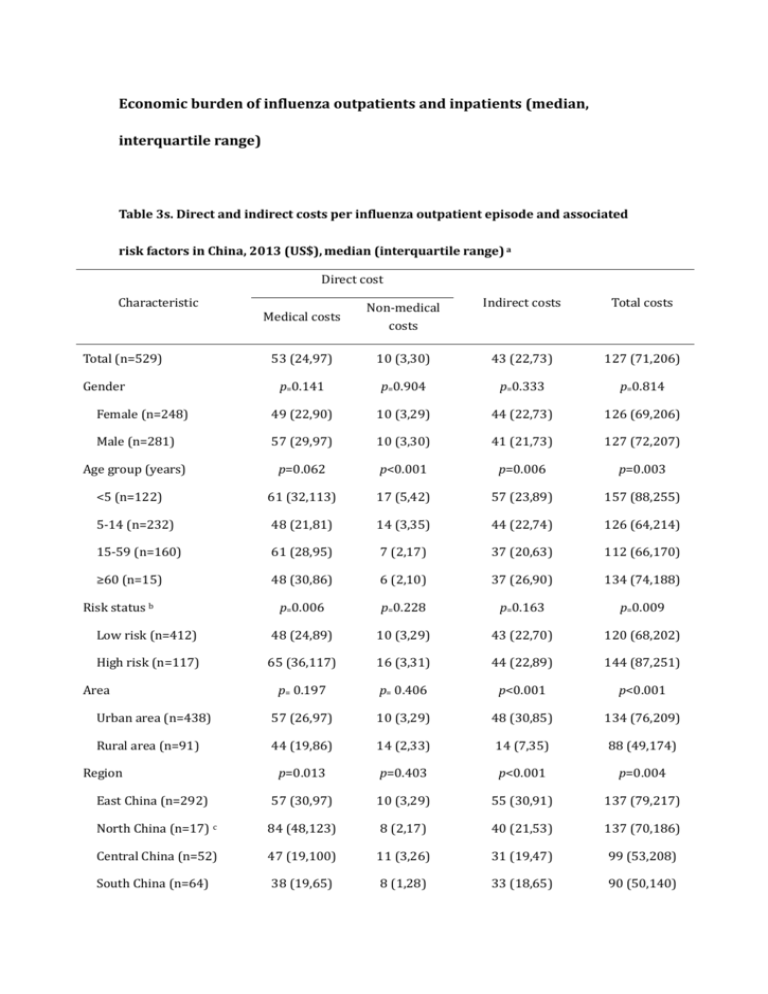
Economic burden of influenza outpatients and inpatients (median, interquartile range) Table 3s. Direct and indirect costs per influenza outpatient episode and associated risk factors in China, 2013 (US$), median (interquartile range) a Direct cost Characteristic Medical costs Non-medical costs Indirect costs Total costs 53 (24,97) 10 (3,30) 43 (22,73) 127 (71,206) p=0.141 p=0.904 p=0.333 p=0.814 Female (n=248) 49 (22,90) 10 (3,29) 44 (22,73) 126 (69,206) Male (n=281) 57 (29,97) 10 (3,30) 41 (21,73) 127 (72,207) Age group (years) p=0.062 p<0.001 p=0.006 p=0.003 <5 (n=122) 61 (32,113) 17 (5,42) 57 (23,89) 157 (88,255) 5-14 (n=232) 48 (21,81) 14 (3,35) 44 (22,74) 126 (64,214) 15-59 (n=160) 61 (28,95) 7 (2,17) 37 (20,63) 112 (66,170) ≥60 (n=15) 48 (30,86) 6 (2,10) 37 (26,90) 134 (74,188) p=0.006 p=0.228 p=0.163 p=0.009 Low risk (n=412) 48 (24,89) 10 (3,29) 43 (22,70) 120 (68,202) High risk (n=117) 65 (36,117) 16 (3,31) 44 (22,89) 144 (87,251) p= 0.197 p= 0.406 p<0.001 p<0.001 Urban area (n=438) 57 (26,97) 10 (3,29) 48 (30,85) 134 (76,209) Rural area (n=91) 44 (19,86) 14 (2,33) 14 (7,35) 88 (49,174) p=0.013 p=0.403 p<0.001 p=0.004 East China (n=292) 57 (30,97) 10 (3,29) 55 (30,91) 137 (79,217) North China (n=17) c 84 (48,123) 8 (2,17) 40 (21,53) 137 (70,186) Central China (n=52) 47 (19,100) 11 (3,26) 31 (19,47) 99 (53,208) South China (n=64) 38 (19,65) 8 (1,28) 33 (18,65) 90 (50,140) Total (n=529) Gender Risk status b Area Region Southwest China (n=68) 59 (23,96) 11 (3,31) 32 (16,60) 142 (68,185) Northwest China (n=36) 59 (36,120) 20 (3,49) 35 (20,54) 122 (74,228) p<0.001 65 (28,101) 48 (32,97) p=0.745 10 (3,30) 9 (3,27) p=0.002 47 (22,78) 43 (22,71) p=0.002 138 (78,216) 125 (70,198) 39 (16,70) 13 (2,31) 33 (15,60) 102 (54,160) p=0.868 p=0.973 p=0.220 p=0.565 Untyped d (n=307) 52 (24,97) 10 (3,30) 44 (22,74) 126 (65,208) Influenza A (n=164) 57 (25,90) 10 (3,30) 43 (22,73) 129 (75,204) Influenza B (n=58) 59 (32,94) 12 (2,28) 37 (18,65) 125 (76,175) Hospital Level 3 (n=298) Level 2 (n=119) Level 1 and lower (n=112) Virus type a Rank-sum test was used for comparing two samples, and Kruskal-Wallis test was used for comparing three or more groups. Risk status: high risk patients refer to those with underlying medical conditions including: chronic respiratory disease, asthma, chronic cardiovascular diseases, diabetes, chronic liver disease, and chronic renal disease, etc. Other patients without these underlying diseases are low risk patients. b c North China: 2 patients from Northeast China were grouped into North China. d Untyped: Laboratory tests for influenza virus type identification were not conducted. Table 4s. Direct and indirect costs per episode for influenza inpatients and associated risk factors in China, 2013 (US$), median (interquartile range) a Direct cost Characteristic Medical cost Non-medical cost Indirect costs Total cost 772(476,1176) 200 (112,338) 148 (87,272) 1154 (780,1812) p=0.479 p=0.863 p=0. 295 p=0. 707 Female (n=107) 694 (484,1156) 194 (110,335) 156(92,280) 1124 (758,1896) Male (n=147) 812 (442,1186) 201 (113,342) 139 (81,240) 1174 (808,1736) Age group (years) p<0.001 p=0.046 p=0. 018 p<0.001 <5 (n=144) 809 (517,1163) 215 (133,364) 157 (95,292) 1201 (901,1803) 5-14 (n=79) 541 (315,1073) 169 (97,306) 120 (69,208) 864 (562,1414) 15-59 (n=27) 986 (691,1307) 159 (87,272) 174 (110,286) 1347 (925,2060) 1856 (1574,2583) 180 (70,340) 193 (148,250) 2223 (1906,3051) p<0.001 p=0.001 p<0.001 p<0.001 Low risk (n=120) 645 (371,1043) 169 (94,305) 120 (70,219) 962 (679,1419) High risk (n=134) 876 (581,1323) 230 (132,363) 174 (103,292) 1286 (1010,2146) p=0. 797 p=0. 285 p<0.001 p=0.330 Urban area (n=171) 726 (484,1146) 197 (107,316) 207 (133,302) 1143 (832,1848) Rural area (n=83) 855 (408,1225) 201 (125,375) 68 (37,110) 1174 (623,1764) p=0.041 p=0.518 p=0.020 p=0.089 East China (n=82) 630 (398,1020) 190 (112,337) 179 (111,351) 1048 (722,1851) North China (n=31) c 1017 (714,1509) 274 (155,400) 171 (101,280) 1464 (1075,2240) Central China (n=67) 888 (81,1145) 195 (94,318) 126 (83,218) 1201 (798,1611) South China (n=31) 694 (444,1186) 208 (114,272) 129 (83,224) 1111 (766,1750) Southwest China (n=24) 582 (276,1183) 189 (134,281) 116 (54,222) 915 (556,1624) Northwest China (n=19) 855 (459,1459) 194 (147,383) 157 (76,200) 1211 (970,2018) p=0.022 p=0.400 p=0. 182 p=0.040 812 (517,1162) 201 (117,339) 153 (87,280) 1182 (858,1797) Total (n=254) Gender ≥60 (n=4) Risk status b Area Region Hospital Level 3 (n=177) Level 2 (n=58) 692 (299,1235) 174 (96,274) 139 (79,265) 1000 (531,1963) Level 1 and lower (n=19) 621 (234,823) 230 (117,410) 142 (54,167) 971 (522,1288) p=0.300 p=0.029 p=0.074 p=0.178 807 (498,1182) 211 (131,341) 157(87,292) 1180 (832,1878) Influenza A (n=34) 541 (311,1181) 161 (89,269) 141 (94,169) 1012 (623,1644) Influenza B (n=36) 783 (379,1126) 147 (82,324) 103 (80,179) 1143 (653,1468) Virus type Untyped d (n=184) a Rank-sum test was used for comparing two samples, and Kruskal-Wallis test was used for comparing three or more groups.. Risk status: high risk patients refer to those with underlying medical conditions including: chronic respiratory disease, asthma, chronic cardiovascular diseases, diabetes, chronic liver disease, and chronic renal disease, etc. Other patients without these underlying diseases are low risk patients. b c North China: 1 patients from Northeast China were grouped into North China. d Untyped: Laboratory tests for influenza virus type identification were not conducted.
