References - BioMed Central
advertisement
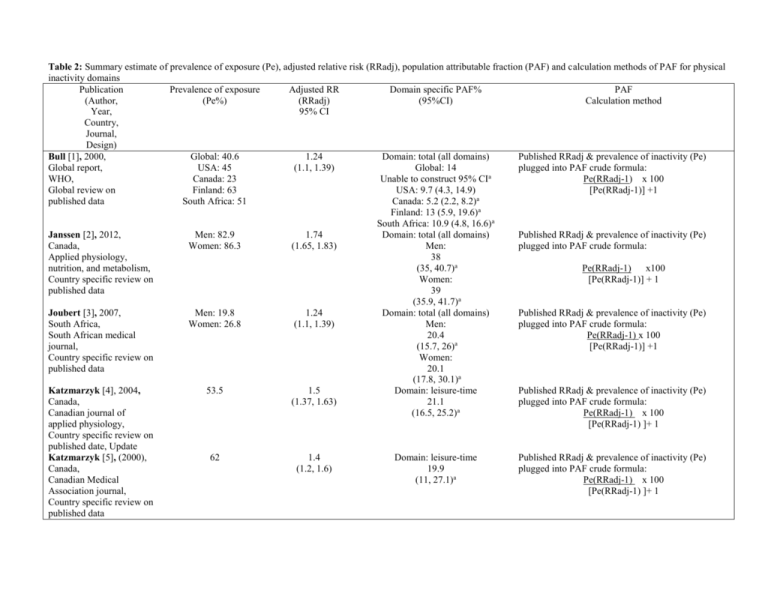
Table 2: Summary estimate of prevalence of exposure (Pe), adjusted relative risk (RRadj), population attributable fraction (PAF) and calculation methods of PAF for physical inactivity domains Publication Prevalence of exposure Adjusted RR Domain specific PAF% PAF (Author, (Pe%) (RRadj) (95%CI) Calculation method Year, 95% CI Country, Journal, Design) Bull [1], 2000, Global: 40.6 1.24 Domain: total (all domains) Published RRadj & prevalence of inactivity (Pe) Global report, USA: 45 (1.1, 1.39) Global: 14 plugged into PAF crude formula: WHO, Canada: 23 Unable to construct 95% CIa Pe(RRadj-1) x 100 Global review on Finland: 63 USA: 9.7 (4.3, 14.9) [Pe(RRadj-1)] +1 published data South Africa: 51 Canada: 5.2 (2.2, 8.2)a Finland: 13 (5.9, 19.6)a South Africa: 10.9 (4.8, 16.6)a Janssen [2], 2012, Men: 82.9 1.74 Domain: total (all domains) Published RRadj & prevalence of inactivity (Pe) Canada, Women: 86.3 (1.65, 1.83) Men: plugged into PAF crude formula: Applied physiology, 38 nutrition, and metabolism, (35, 40.7)a Pe(RRadj-1) x100 Country specific review on Women: [Pe(RRadj-1)] + 1 published data 39 (35.9, 41.7)a Joubert [3], 2007, Men: 19.8 1.24 Domain: total (all domains) Published RRadj & prevalence of inactivity (Pe) South Africa, Women: 26.8 (1.1, 1.39) Men: plugged into PAF crude formula: South African medical 20.4 Pe(RRadj-1) x 100 journal, (15.7, 26)a [Pe(RRadj-1)] +1 Country specific review on Women: published data 20.1 (17.8, 30.1)a Katzmarzyk [4], 2004, 53.5 1.5 Domain: leisure-time Published RRadj & prevalence of inactivity (Pe) Canada, (1.37, 1.63) 21.1 plugged into PAF crude formula: Canadian journal of (16.5, 25.2)a Pe(RRadj-1) x 100 applied physiology, [Pe(RRadj-1) ]+ 1 Country specific review on published date, Update Katzmarzyk [5], (2000), 62 1.4 Domain: leisure-time Published RRadj & prevalence of inactivity (Pe) Canada, (1.2, 1.6) 19.9 plugged into PAF crude formula: Canadian Medical (11, 27.1)a Pe(RRadj-1) x 100 Association journal, [Pe(RRadj-1) ]+ 1 Country specific review on published data Table 2: Summary estimate of prevalence of exposure (Pe), adjusted relative risk (RRadj), population attributable fraction (PAF) and calculation methods of PAF for physical inactivity domains Publication Prevalence of exposure Adjusted RR Domain specific PAF% PAF (Author, (Pe%) (RRadj) (95%CI) Calculation method Year, 95% CI Country, Journal, Design) Laaksonen [6], (2010), 24.1 1.35 Domain: leisure-time; exercise Piecewise constant hazard ratio, logarithmic Finland, (.97, 1.6) subset transformation, delta method for 95% CI, censored European journal of 7 for DM-2, death and lost follow up epidemiology, (-9, 20) Cohort Laaksonen [6], (2010), 36.5 1.28 Domain: leisure-time; exercise Piecewise constant hazard ratio, logarithmic Finland, (.99, 1.48) subset transformation, delta method for 95% CI, censored European journal of 3 for DM-2, death and lost follow up epidemiology, (-11, 16) Cohort Lee [7], (2012), Global: 35.2 1.2 Domain: leisure-time Published RRadj & prevalence of inactivity (Pe) Global report, USA: 43.2 (1.1, 1.33) Global: 7.2 (3.9, 9.6) plugged into PAF crude formula: Lancet, Canada: 35.7 USA: 8.3 (4.2, 12.9) Pe(RRadj-1) x 100 Global review on Finland: 40.8 Canada: 7 (0.8, 14.4) RRadj published data South Africa: 51.1 Finland: 7.8 (1.3, 15.6) South Africa: 10.7 (5.4, 16.8) Steinbrecher [8], Men Men: Domain: leisure-time; sport subset Cox proportional hazard model (2011), 55.2 1.21 Men: USA, Women (1.1, 1.35) 13 Journal of physical activity 66.3 Women: (3, 22) & health, 1.43 Women: Cohort (1,21, 1.68) 29 (17, 41) a substitution methods References 1. Bull FC, Armstrong TP, Dixon T, Ham S, Neiman A, Pratt M: Physical inactivity. In Comparative quantification of health risks. Volume 1. Edited by Ezzati M, Lopez A, Rodgers A, Murray C. World Health Organization; 2004:729-882. 2. Janssen I: Health care costs of physical inactivity in Canadian adults. Applied Physiology, Nutrition, and Metabolism 2012, 37(4):803-806. 3. Joubert J, Norman R, Lambert EV, Groenewald P, Schneider M, Bull F, Debbie B: Estimating the burden of disease attributable to physical inactivity in South Africa in 2000. South African Medical Journal 2007, 97:725+. 4. Katzmarzyk PT, Janssen I: The Economic Costs Associated With Physical Inactivity and Obesity in Canada: An Update. Can J Appl Physiol 2004, 29(1):90-115. 5. Katzmarzyk PT, Gledhill N, Shephard RJ: The economic burden of physical inactivity in Canada. Canadian Medical Association Journal 2000, 163(11):1435-1440. 6. Laaksonen MA, Knekt P, Rissanen H, Härkänen T, Virtala E, Marniemi J, Aromaa A, Heliövaara M, Reunanen A: The relative importance of modifiable potential risk factors of type 2 diabetes: a meta-analysis of two cohorts. Eur J Epidemiol 2010, 25(2):115-124. 7. Lee I, Shiroma EJ, Lobelo F, Puska P, Blair SN, Katzmarzyk PT: Effect of physical inactivity on major non-communicable diseases worldwide: an analysis of burden of disease and life expectancy. The Lancet 2012, 380(9838):219-229. 8. Steinbrecher A, Morimoto Y, Heak S, Ollberding NJ, Geller KS, Grandinetti A, Kolonel LN, Maskarinec G: The preventable proportion of type 2 diabetes by ethnicity: the multiethnic cohort. Ann Epidemiol 2011, 21(7):526-535.


