PSPICE Assignment #3
advertisement
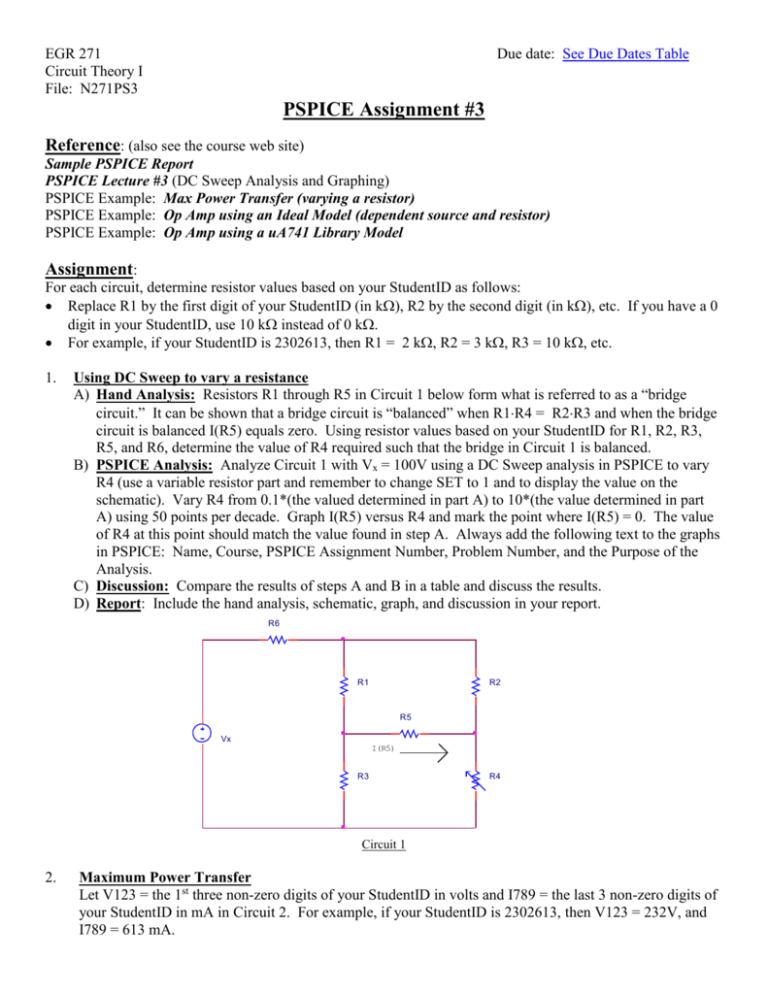
EGR 271 Circuit Theory I File: N271PS3 Due date: See Due Dates Table PSPICE Assignment #3 Reference: (also see the course web site) Sample PSPICE Report PSPICE Lecture #3 (DC Sweep Analysis and Graphing) PSPICE Example: Max Power Transfer (varying a resistor) PSPICE Example: Op Amp using an Ideal Model (dependent source and resistor) PSPICE Example: Op Amp using a uA741 Library Model Assignment: For each circuit, determine resistor values based on your StudentID as follows: Replace R1 by the first digit of your StudentID (in k), R2 by the second digit (in k), etc. If you have a 0 digit in your StudentID, use 10 k instead of 0 k. For example, if your StudentID is 2302613, then R1 = 2 k, R2 = 3 k, R3 = 10 k, etc. 1. Using DC Sweep to vary a resistance A) Hand Analysis: Resistors R1 through R5 in Circuit 1 below form what is referred to as a “bridge circuit.” It can be shown that a bridge circuit is “balanced” when R1R4 = R2R3 and when the bridge circuit is balanced I(R5) equals zero. Using resistor values based on your StudentID for R1, R2, R3, R5, and R6, determine the value of R4 required such that the bridge in Circuit 1 is balanced. B) PSPICE Analysis: Analyze Circuit 1 with Vx = 100V using a DC Sweep analysis in PSPICE to vary R4 (use a variable resistor part and remember to change SET to 1 and to display the value on the schematic). Vary R4 from 0.1*(the valued determined in part A) to 10*(the value determined in part A) using 50 points per decade. Graph I(R5) versus R4 and mark the point where I(R5) = 0. The value of R4 at this point should match the value found in step A. Always add the following text to the graphs in PSPICE: Name, Course, PSPICE Assignment Number, Problem Number, and the Purpose of the Analysis. C) Discussion: Compare the results of steps A and B in a table and discuss the results. D) Report: Include the hand analysis, schematic, graph, and discussion in your report. R6 R1 R2 R5 Vx I(R5) R3 R4 Circuit 1 2. Maximum Power Transfer Let V123 = the 1st three non-zero digits of your StudentID in volts and I789 = the last 3 non-zero digits of your StudentID in mA in Circuit 2. For example, if your StudentID is 2302613, then V123 = 232V, and I789 = 613 mA. A) Hand Analysis: Analyze Circuit 2 by hand in order to determine the value of RL such that maximum power is delivered to RL and to determine the value of maximum power that is delivered to RL. B) PSPICE Analysis: Use PSPICE to analyze Circuit 2 where RL varies from 0.1RTh to 10RTh using the value of RTh determined in step A. Use at least 50 points per decade in the analysis. Plot PL vs RL with RL on a log scale using PROBE (you can plot the function VL*VL/RL ). Place a cursor on the maximum point on this graph (use the PEAK function in PROBE) and mark the point. This point will correspond to Rth and Pmax. Always add the following text to the graphs in PSPICE: Name, Course, PSPICE Assignment Number, Problem Number, and the Purpose of the Analysis. C) Discussion: Compare the values of Rth and Pmax determined in steps A and B in a table and discuss the results. D) Report: Include the hand analysis, schematic, graph, and discussion in your report. R1 I789 R3 R2 R5 + R4 V123 VL RL - Circuit 2 3. Operational Amplifiers A) Hand Analysis: Analyze Circuit 3 by hand to determine the voltage Vo and the current Io specified in the problem. Neatly show all calculations. B) Analysis by PSPICE using a uA741 op amp: Determine the voltage Vo and the current Io in Circuit 3 using PSPICE with the op amp replaced by the uA741 op amp. Be sure to use a supply voltage large enough such that the op amp is not saturated. Use a voltage printer and a current printer to display the values of Vo and Io. C) Analysis by PSPICE using an op amp model consisting of a resistor and a dependent source: Determine voltage Vo and the current Io in Circuit 5 using PSPICE with the op amp replaced by the general op amp model (i.e., a voltage-controlled voltage source and a huge resistor). Use a voltage printer and a current printer to display the values of Vo and Io. D) Comparison: Compare the results of steps B, C, and D in a table and discuss the results. Be sure to discuss how you determine the values of the supply voltages in part B. D) Report: Include the hand analysis, the schematics for parts B and C, the .OUT files for parts B and C with Io and Vo highlighted and labeled, and the discussion in your report. _ Io R1 Vo + 8V + _ R2 R4 R3 Circuit 3 R5


