TABLES for Electronic Supplementary material Table S1: Catchment
advertisement
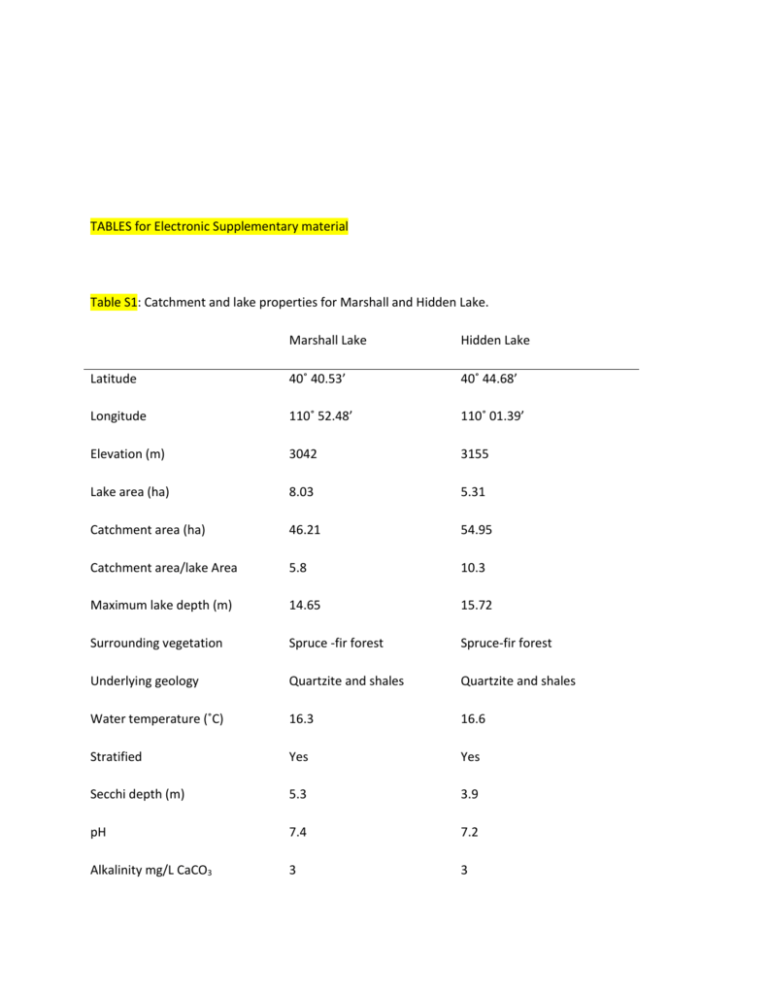
TABLES for Electronic Supplementary material Table S1: Catchment and lake properties for Marshall and Hidden Lake. Marshall Lake Hidden Lake Latitude 40˚ 40.53’ 40˚ 44.68’ Longitude 110˚ 52.48’ 110˚ 01.39’ Elevation (m) 3042 3155 Lake area (ha) 8.03 5.31 Catchment area (ha) 46.21 54.95 Catchment area/lake Area 5.8 10.3 Maximum lake depth (m) 14.65 15.72 Surrounding vegetation Spruce -fir forest Spruce-fir forest Underlying geology Quartzite and shales Quartzite and shales Water temperature (˚C) 16.3 16.6 Stratified Yes Yes Secchi depth (m) 5.3 3.9 pH 7.4 7.2 Alkalinity mg/L CaCO3 3 3 Specific conductivity (μS/cm) 15.4 14.9 Table S2: Precipitation data for Uinta Mountain sites. Data for the Chepeta SNOTEL site is from the National Water and Climate Center (2009) and for Vernal and Heber Airport from the Western Regional Climate Center (2009). All values are 30-year means of annual averages for the period 1971-2000. Site Latitude Longitude Elevation (m) Mean Annual Precipitation (mm) Chepeta SNOTEL 40˚47’N 110˚01’W 3228 800 Vernal Airport 40˚26’N 109˚30’W 1668 223 Heber Airport 40˚29’N 111˚43’W 1704 412 Figures for Electronic supplementary material Figure S1. 210Pb activities and dates for A), C) Marshall Lake and B), D) Hidden Lake. C and D were previously published in Reynolds et al. (2009). Figure S2. Principal components analysis plots of geochemical data for Marshall Lake. A) shows geochemical variables. Each element is represented by an arrow, such that the smaller the angle between the arrows the more strongly correlated the two variables. Arrows at 90 degrees to one another are uncorrelated, whereas arrows that plot in opposite directions are negatively correlated. B) is a plot of samples showing changes in geochemistry with time. Each point represents a different sediment depth and the distance between points estimates Euclidean distances, so that less distance indicates greater geochemical similarity. Figure S3. Principal components analysis plots of geochemical data for Hidden Lake. A) shows geochemical variables. B) is a plot of changes in geochemistry with time. Further explanation is provided in Figure S2. Figure S4. Plots showing diatom assemblages at depth for A) Marshall Lake and B) Hidden Lake. Plots show relative abundance of each taxa at a given depth.


