Supplementary Materials (4 Tables and 5 Figures) Table S1 Primers
advertisement
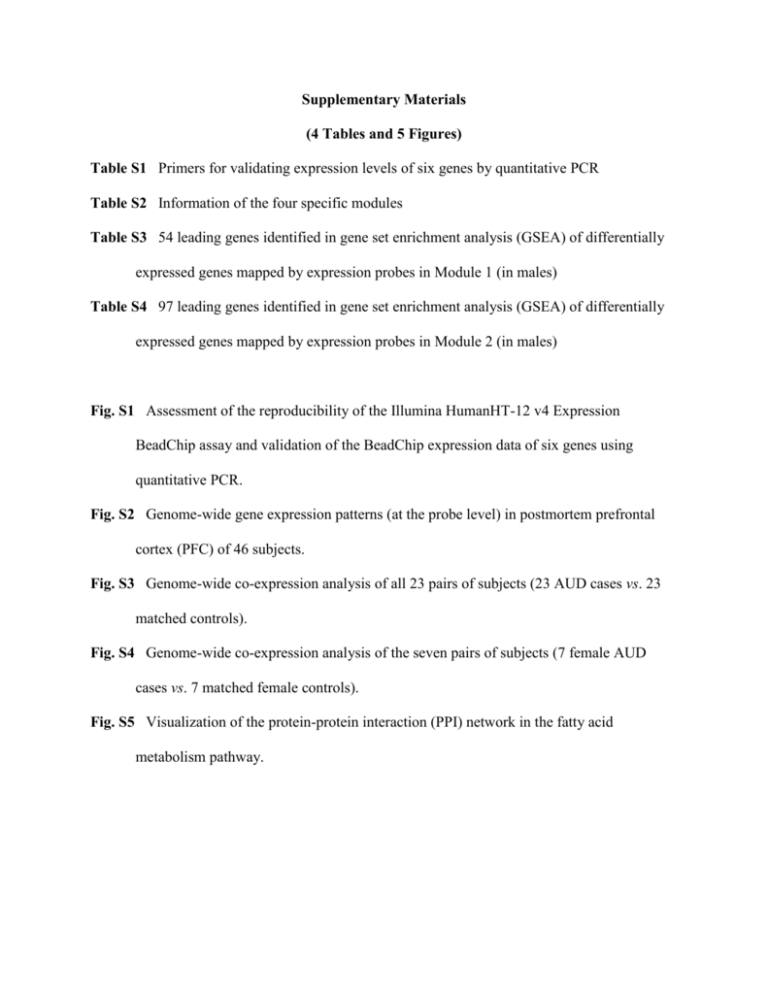
Supplementary Materials (4 Tables and 5 Figures) Table S1 Primers for validating expression levels of six genes by quantitative PCR Table S2 Information of the four specific modules Table S3 54 leading genes identified in gene set enrichment analysis (GSEA) of differentially expressed genes mapped by expression probes in Module 1 (in males) Table S4 97 leading genes identified in gene set enrichment analysis (GSEA) of differentially expressed genes mapped by expression probes in Module 2 (in males) Fig. S1 Assessment of the reproducibility of the Illumina HumanHT-12 v4 Expression BeadChip assay and validation of the BeadChip expression data of six genes using quantitative PCR. Fig. S2 Genome-wide gene expression patterns (at the probe level) in postmortem prefrontal cortex (PFC) of 46 subjects. Fig. S3 Genome-wide co-expression analysis of all 23 pairs of subjects (23 AUD cases vs. 23 matched controls). Fig. S4 Genome-wide co-expression analysis of the seven pairs of subjects (7 female AUD cases vs. 7 matched female controls). Fig. S5 Visualization of the protein-protein interaction (PPI) network in the fatty acid metabolism pathway. Table S1 Primers for validating expression levels of six genes by quantitative PCR Gene (GenBank) Primers Sequences (5'-3') PCR product size (bp) AGT forward AGACTGGCTGCTCCCTGAT 185 (NM_000029) reverse ACTCCAGTGCTGGAAGGTG ALDH1L1 (NM_012190) forward reverse AGATTGCAGTGATTGGACAGAG CCAAAGCCTGGTATTTTGCCA 225 GABRA1 (NM_001127647) forward reverse AGCCGTCATTACAAGATGAACTT TGGTCTCAGGCGATTGTCATAA 95 GRIN2C (NM_000835) forward reverse GAGTGGTCAAATTCTCCTACGAC TGTAGTACACCTCCCCAATCAT 102 PAX6 (NM_001604) forward reverse TGGGCAGGTATTACGAGACTG ACTCCCGCTTATACTGGGCTA 111 SLC1A3 (NM_004172) forward reverse GGCCAAGAAGAAAGTGCAGA GCATCTGTAACATCCTCATCAGA 200 Rn18s (reference) forward CAGCCACCCGAGATTGAGCA 253 (NM10098) reverse TAGTAGCGACGGGCGGTGTG SYBR green-based real-time quantitative PCRs were performed for detecting the relative expression levels of six genes that showed significant expression differences (by expression array-based assays) between 23 AUD cases and 23 matched controls by paired t-tests. About 2 μg of total RNAs were converted to cDNAs under the standard protocol of the High Capacity RNA-to-cDNA Kit (Applied Biosystems, Foster City, CA). 20 µL of PCR reaction was prepared in a mixture containing 10µL of 2× SYBR Green PCR Master Mix, 1 µL of each forward/reverse primer, 2µL of cDNA template (~5.0 ng/μL), and 6 µL of RNase-free ddH2O. Each reaction was performed in triplicate. The cycling conditions were 95°C 10 min plus 45 three-step cycles: 95°C 30 sec, 57°C 30 sec, and 72°C 30 sec. To normalize relative expression levels, a calibrator was set up using a cDNA mix that was pooled from cDNAs of the 46 subjects. After real-time PCRs, the Cq (threshold cycle) of the target gene (Cq T) or the reference gene (Cq E) was analyzed using programs SDS version 2.3 and RQ manager version 1.3 (Applied Biosystems). Reaction wells with Cq ≥ 40 or differences between Cq and mean Cq greater than 0.3 was excluded for further analysis. The relative expression level ΔCq (Cq T - Cq E) of the target gene was normalized to the reference gene Rn18s. Average ΔCq was used to represent the relative expression level of the target genes that were normalized to the reference gene; the larger ΔCq, the lower relative expression level. Table S2 Information of the four specific modules Correlation with Total Probes AUDs Modules probes (P<0.05) r P Module 1 (male:magenta) 561 177 0.42 0.020 Module 2 (male:red) Module 3 (male:brown) Module 4 (female:yellow) GSEA mapped genes P 134 0.028 815 326 0.41 0.020 243 0.004 1,446 255 -0.38 0.030 197 0.566 683 62 0.64 0.010 46 0.539 Table S3 54 leading genes identified in gene set enrichment analysis (GSEA) of differentially expressed genes mapped by expression probes in Module 1 (in males) PROBE GENE SYMBOL 1 C1orf54 FAM65B PLXNB2 ITGB5 MSI2 PITPNC1 CYB5B AKR1C3 PSPC1 TAP1 ARAP3 BAG3 SEMA3E NRG1 CLEC2B ALDH1L1 GNA12 LPP RYK AHSA1 IMPA2 DHRS3 GLIS3 CCDC91 SCARA3 MOV10 ALDH7A1 FERMT2 ACAA2 FEZ1 MASP1 PALLD ASPSCR1 ATP7B IGDCC4 CIDEA ABCA1 C10orf54 2 3 4 5 6 7 8 9 10 11 12 13 14 15 16 17 18 19 20 21 22 23 24 25 26 27 28 29 30 31 32 33 34 35 36 37 38 RANK METRIC SCORE RUNNING ES CORE ENRICHMENT 60 4.644 0.018 187 3.907 0.029 278 3.682 0.041 403 3.451 0.049 432 3.416 0.064 440 3.411 0.079 478 3.365 0.092 561 3.26 0.103 857 3.01 0.1 1030 2.893 0.103 1069 2.873 0.114 1210 2.81 0.119 1262 2.783 0.129 1264 2.783 0.142 1281 2.777 0.154 1436 2.708 0.157 1493 2.684 0.166 1592 2.646 0.173 1613 2.638 0.184 1752 2.582 0.188 1788 2.572 0.198 1835 2.554 0.207 1873 2.544 0.217 1882 2.542 0.228 1968 2.511 0.235 2005 2.499 0.244 2319 2.402 0.237 2512 2.346 0.237 2686 2.297 0.238 2955 2.223 0.233 2977 2.219 0.242 2981 2.218 0.252 3111 2.192 0.254 3438 2.125 0.245 3521 2.108 0.25 3629 2.085 0.254 3652 2.081 0.262 3727 2.068 0.268 39 40 41 42 43 44 45 46 47 48 49 50 51 52 53 54 TIMP3 GALM WFS1 PTTG1IP HSDL2 TGFBR3 CPT2 PXN DTNA IFITM2 SLC7A2 PARP9 FEM1C PRMT2 LAMC1 LYN 3743 2.066 0.276 3757 2.063 0.285 4153 1.987 0.271 4237 1.979 0.276 4517 1.932 0.269 4776 1.883 0.263 4818 1.876 0.269 4895 1.866 0.273 4918 1.863 0.28 4928 1.86 0.289 4945 1.857 0.296 4981 1.851 0.303 4984 1.851 0.311 5070 1.839 0.315 5165 1.821 0.318 5175 1.821 0.326 Table S4 97 leading genes identified in gene set enrichment analysis (GSEA) of differentially expressed genes mapped by expression probes in Module 2 (in males) PROBE GENE SYMBOL RUNNING ES CORE ENRICHMENT DARS RANK METRIC SCORE 44 1 4.77 0.0096 2 RYR1 147 4.027 0.014 3 DDAH1 155 3.991 0.0238 4 CPE 161 3.971 0.0336 5 NFIB 208 3.83 0.0407 6 ITPR2 271 3.699 0.0465 7 AUTS2 281 3.674 0.0554 8 SLC39A12 282 3.674 0.0647 9 NTM 305 3.622 0.0727 10 RYR3 306 3.622 0.0819 11 LPAR3 349 3.539 0.0885 12 FYN 470 3.375 0.0902 13 CADM1 502 3.332 0.0969 14 SPON1 545 3.277 0.1028 15 NTRK2 600 3.221 0.1079 16 GPC5 620 3.201 0.115 17 PAX6 652 3.172 0.1213 18 LRRC16A 660 3.164 0.1289 19 GPR98 823 3.034 0.1273 20 BCL2 897 2.987 0.1307 21 AHCTF1 1003 2.907 0.132 22 NAV2 1020 2.9 0.1385 23 SPRED1 1036 2.889 0.145 24 EYA2 1114 2.854 0.1478 25 PCDHGC3 1170 2.827 0.1519 26 KCNN3 1213 2.807 0.1566 27 CGNL1 1233 2.799 0.1626 28 PAMR1 1396 2.726 0.1602 29 RGL1 1518 2.674 0.1601 30 PAPLN 1736 2.588 0.1541 31 MYO5A 1740 2.587 0.1605 32 NEBL 1827 2.556 0.1621 33 CYBRD1 1870 2.544 0.1662 34 GRAMD3 1904 2.535 0.1707 35 PRDM16 1925 2.526 0.176 36 HADH 1938 2.52 0.1817 37 ACACB 2088 2.472 0.1794 38 MICAL2 2116 2.465 0.1841 39 ACSL6 2299 2.41 0.1798 40 ABLIM1 2301 2.41 0.1859 41 RAB31 2312 2.405 0.1914 42 CACHD1 2390 2.381 0.193 43 PPAP2B 2518 2.344 0.1917 44 NT5C2 2526 2.342 0.1972 45 WWC1 2613 2.315 0.1982 46 SMO 2646 2.307 0.2022 47 EPHX2 2647 2.307 0.2081 48 CABLES1 2648 2.307 0.214 49 SLC14A1 2650 2.306 0.2198 50 RERG 2679 2.298 0.224 51 CNTFR 2684 2.297 0.2297 52 GCNT2 2731 2.285 0.2328 53 PRODH 2777 2.272 0.236 54 SLC22A5 2814 2.261 0.2397 55 CYP2U1 2867 2.248 0.2424 56 APCDD1 2937 2.228 0.2441 57 RHPN2 2948 2.225 0.2492 58 SLC1A2 3030 2.208 0.2502 59 MAP3K5 3071 2.201 0.2535 60 RBM43 3095 2.194 0.2577 61 FGGY 3125 2.189 0.2616 62 PHYHD1 3140 2.185 0.2664 63 ZIC2 3196 2.176 0.2688 64 ATP1B2 3219 2.171 0.273 65 EYA1 3337 2.146 0.2717 66 OAF 3398 2.133 0.2737 67 BBS2 3399 2.132 0.2791 68 CHPT1 3471 2.115 0.2804 69 LRIG1 3542 2.103 0.2818 70 WIF1 3593 2.092 0.2842 71 PLCG1 3608 2.09 0.2887 72 FABP3 3609 2.089 0.294 73 HEATR2 3622 2.086 0.2987 74 JARID2 3646 2.082 0.3026 75 DOCK7 3651 2.081 0.3077 76 TPD52L1 3733 2.067 0.3083 77 OGFOD1 3865 2.042 0.306 78 MYBPC1 4074 2.004 0.2991 79 GLUD1 4160 1.987 0.2992 80 GLI3 4184 1.983 0.3029 81 C14orf159 4255 1.975 0.3039 82 ATP13A4 4315 1.963 0.3055 83 TPP1 4467 1.939 0.3018 84 SLC1A3 4508 1.932 0.3044 85 CALML4 4522 1.932 0.3085 86 LARS 4579 1.921 0.3102 87 DYNLL2 4591 1.921 0.3145 88 EGFR 4638 1.91 0.3167 89 SERPINE2 4865 1.87 0.3084 90 RANBP3L 4943 1.857 0.3087 91 APPL2 4948 1.857 0.3132 92 PPP1R1B 4954 1.857 0.3176 93 IL17RB 5053 1.839 0.3167 94 PLOD2 5154 1.824 0.3155 95 RERE 5220 1.812 0.3164 96 INHBB 5335 1.799 0.3144 97 UNG 5353 1.799 0.318 Fig. S1 Assessment of the reproducibility of the Illumina HumanHT-12 v4 Expression BeadChip assay and validation of the BeadChip expression data of six genes using quantitative PCR. (a) Correlation of genome-wide gene expression levels of Sample #38 measured by Chip 1 and Chip 2. (b) Correlation of genome-wide gene expression levels of Sample #38 measured by Chip 1 and Chip 3. (b) Correlation of genome-wide gene expression levels of Sample #38 measured by Chip 2 and Chip 3. (d) Correlation of expression levels of six genes (AGT, ALDH1L1, GABRA1, GRIN2C, PAX6, and SLC1A3) measured by the Illumina HumanHT-12 v4 Expression BeadChip assay and quantitative PCR (indicated by delta Ct values normalized to the reference gene Rn18s). Expression levels of six genes measured by the expression array-based approach were validated using quantitative PCR in all 46 postmortem prefrontal cortex (PFC) RNA samples. Correlation of the mean expression levels of the six genes measured by the two methods was analyzed and the correlation coefficient was -0.869. Fig. S2 Genome-wide gene expression patterns (at the probe level) in postmortem prefrontal cortex (PFC) of 46 subjects. X axis: RNA sample IDs (#1 - #23: healthy subjects; #24 - #46: subjects with alcohol use disorders or AUDs). Y axis: normalized gene expression levels. From top to bottom, statistics such as maximum, 3rd quantile, median, 1st quantile, and minimum values are shown in the box plot. Fig. S3 Genome-wide co-expression analysis of all 23 pairs of subjects (23 AUD cases vs. 23 matched controls). Weighted gene co-expression network analysis (WGCNA) was performed to assess the intercorrelation of the intensities of 21,521 expression probes in all 23 pairs of subjects. (a) Dendrogram of 11 modules identified by WGCNA under default setting. (b) Association of 11 modules with clinical traits [alcohol use disorders (AUDs), age, postmortem internal (PMI), or alcohol daily use in grams (AlcGram)]. Fig. S4 Genome-wide co-expression analysis of the seven pairs of subjects (7 female AUD cases vs. 7 matched female controls). Weighted gene co-expression network analysis (WGCNA) was performed to assess the intercorrelation of the intensities of genome-wide expression probes (n = 21,521) in the seven pairs of subjects. (a) Dendrogram of 15 modules identified by WGCNA under default setting. (b) Association of 15 modules with clinical traits [alcohol use disorders (AUDs), age, postmortem internal (PMI), or alcohol daily use in grams (AlcGram)]. Fig. S5 Visualization of the protein-protein interaction (PPI) network in the fatty acid metabolism pathway. The protein-protein interaction (PPI) network was obtained from the STRING 9.0 database built in program EnrichNet for 327 unique genes from two AUDs-associated modules (Modules 1 and 2) identified in the 16 pairs of male subjects (16 male AUD cases vs. 16 male controls). The visualization consisted of a force-directed graphic layout of the sub-network containing 327 uploaded genes (the blue nodes), 32 genes (the red nodes) in the fatty acid metabolism pathway, and nine overlapped genes (the green nodes) in a human protein-protein interaction (PPI) network (and three of these genes, including ALDH9A1, ALDH7A1, and ALDH2, are involved in aldehyde detoxification).

