File
advertisement

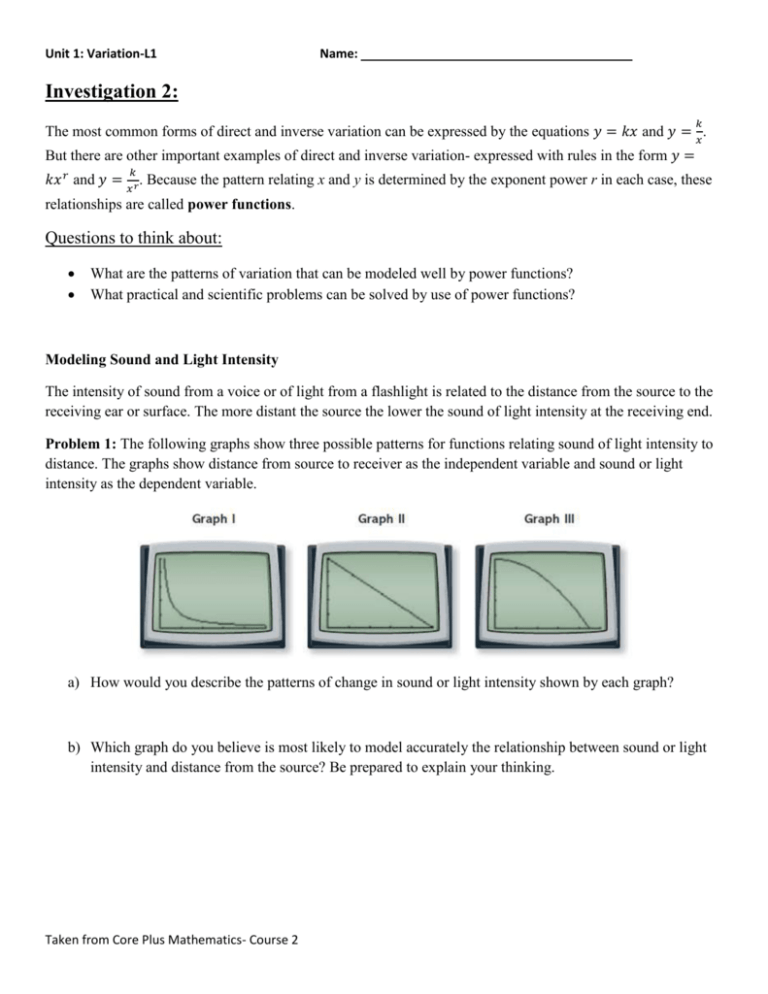
Unit 1: Variation-L1 Name: Investigation 2: 𝑘 The most common forms of direct and inverse variation can be expressed by the equations 𝑦 = 𝑘𝑥 and 𝑦 = 𝑥 . But there are other important examples of direct and inverse variation- expressed with rules in the form 𝑦 = 𝑘 𝑘𝑥 𝑟 and 𝑦 = 𝑥 𝑟 . Because the pattern relating x and y is determined by the exponent power r in each case, these relationships are called power functions. Questions to think about: What are the patterns of variation that can be modeled well by power functions? What practical and scientific problems can be solved by use of power functions? Modeling Sound and Light Intensity The intensity of sound from a voice or of light from a flashlight is related to the distance from the source to the receiving ear or surface. The more distant the source the lower the sound of light intensity at the receiving end. Problem 1: The following graphs show three possible patterns for functions relating sound of light intensity to distance. The graphs show distance from source to receiver as the independent variable and sound or light intensity as the dependent variable. a) How would you describe the patterns of change in sound or light intensity shown by each graph? b) Which graph do you believe is most likely to model accurately the relationship between sound or light intensity and distance from the source? Be prepared to explain your thinking. Taken from Core Plus Mathematics- Course 2 Unit 1: Variation-L1 Name: Problem 2: You could test your ideas about the (distance, intensity) relationship by collecting data from an experiment. But you can also get good ideas by mathematical reasoning alone. Consider what would happen if you were to enter a dark room and shine a small flashlight directly at a flat surface like a wall. The flashlight will create a circle of light on the wall. a) Complete entries in the following table that contains measurements of light circle diameter for one flashlight that has been held at several distances from a wall. Distance and diameter measurements are in feet. Express the area in terms of 𝜋. b) Write rules that show. i. Diameter of light circle as a function of distance from the light source. ii. Radius of light circle as a function of distance from the light source. iii. Area of light circle as a function of distance from the light source. c) Describe the relationships of the geometric variables diameter, radius and area by completing like this: “The variable is proportional to , with constant proportionality .” d) Light energy is measured in a unity called lumens. The intensity of light is measured in lumens per unit of area. As the light circle of a flashlight or lamp increases in size, the intensity of light decreases. To explore how that decrease in light intensity is related to distance from source to target, suppose that the Taken from Core Plus Mathematics- Course 2 Unit 1: Variation-L1 Name: flashlight that gave (distance, diameter) values in Part a produces 160 lumens of light energy. Use the area data from Part a to complete this table relating light intensity I to distance x. e) Write a rule that shows light intensity I as a function of distance x from source to receiving surface. f) Study the graph of the light intensity function in Part e. i. Which of the graph shapes in Problem 1 seems to best model the pattern of change in light intensity as distance from source to receiver increases? ii. Explain in words what the pattern of change shown by the light intensity function and its graph tells about the effective range of a flashlight or lamp. The Power Function Family The functions describing dependence of light circle area and light intensity on distance are only two of many direct and inverse variation patterns that can be modeled by rules in the form 𝑘 𝑦 = 𝑘𝑥 𝑟 and 𝑦 = 𝑥 𝑟 . Use your calculator or a computer graphing tool to explore the relationship between the power r, the constant of proportionality k, and the numerical patterns relating x to y. To get a good picture of each graph, be sure to set your graphing window so you see both positive and negative values of x and y. You can use the zoom feature of your graphing tool to see more of each graph. Taken from Core Plus Mathematics- Course 2 Unit 1: Variation-L1 Name: Problem 3: How is shape f the graph for a direct variation function 𝑦 = 𝑘𝑥 𝑟 related to the values of r and k? a) To see patterns that help answer this question, you might begin by studying examples in which k =1 and r = 1, 2, 3, 4, 5, and 6. Then explore what happens for different positive and negative values of the proportionality constant. Describe the patterns you observe. b) Based on the calculations involved in the different rules used is Part a, explain why the different observed patterns make sense. Taken from Core Plus Mathematics- Course 2 Unit 1: Variation-L1 Name: 𝑘 Problem 4: How is the shape of the graph for an inverse variation function 𝑦 = 𝑥 𝑟 related to the values of r and k. a) To see patterns that help answer this question, you might begin by studying examples in which k =1 and r = 1, 2, 3, 4, 5, and 6. Then explore what happens for different positive and negative values of the proportionality constant. Describe the patterns you observe. b) Based on the calculations involved in the different rules used is Part a, explain why the different observed patterns make sense. Taken from Core Plus Mathematics- Course 2 Unit 1: Variation-L1 Name: Problem 6: When you suspect that the relationship between two variables will be modeled well by a power function, you can use a calculator or computer curve-fitting tool to find a power regression rule for the function. a) Use the (distance, area) values from your table in Problem 2 Part a and calculator to find the power model that fits the data pattern. Explain why the rule derived in this way is similar to or different from what you developed by reasoning alone. b) Use the (distance, intensity) values from your table in Problem 2 Part d and calculator to find the power model that fits the data pattern. Explain why the rule derived in this way is similar to or different from what you developed by reasoning alone. Taken from Core Plus Mathematics- Course 2


