Supporting Information Figs S1–S4, Tables S1 & S2 and
advertisement
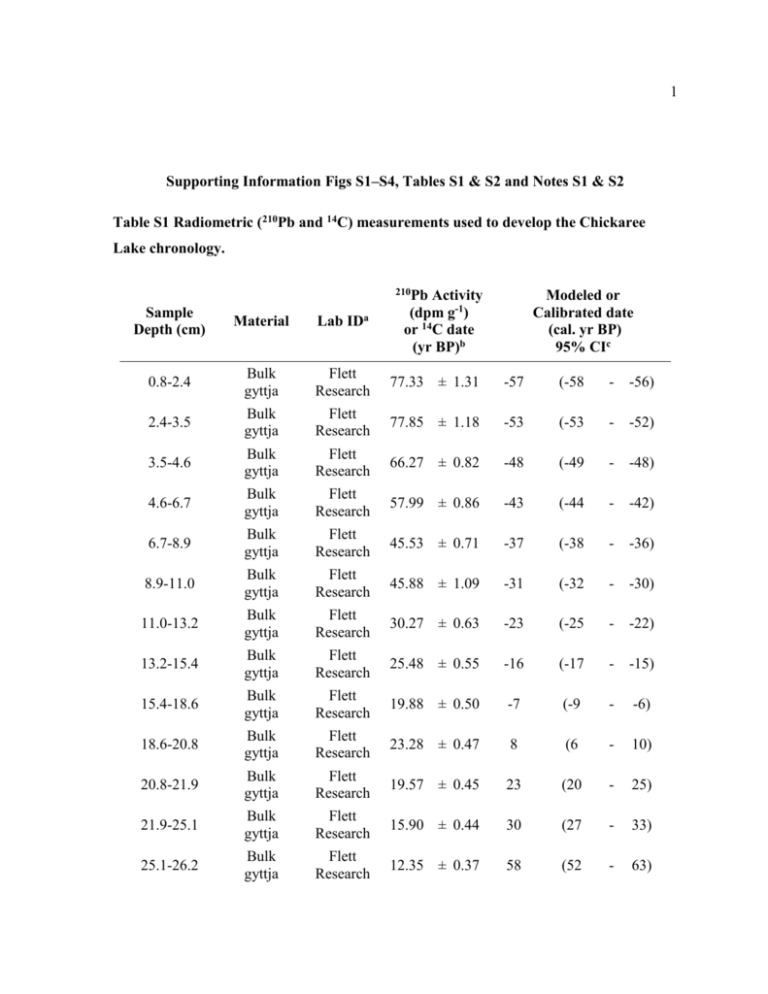
1 Supporting Information Figs S1–S4, Tables S1 & S2 and Notes S1 & S2 Table S1 Radiometric (210Pb and 14C) measurements used to develop the Chickaree Lake chronology. 210Pb Sample Depth (cm) Material Lab IDa Activity (dpm g-1) or 14C date (yr BP)b Modeled or Calibrated date (cal. yr BP) 95% CIc 0.8-2.4 Bulk gyttja Flett Research 77.33 ± 1.31 -57 (-58 - -56) 2.4-3.5 Bulk gyttja Flett Research 77.85 ± 1.18 -53 (-53 - -52) 3.5-4.6 Bulk gyttja Flett Research 66.27 ± 0.82 -48 (-49 - -48) 4.6-6.7 Bulk gyttja Flett Research 57.99 ± 0.86 -43 (-44 - -42) 6.7-8.9 Bulk gyttja Flett Research 45.53 ± 0.71 -37 (-38 - -36) 8.9-11.0 Bulk gyttja Flett Research 45.88 ± 1.09 -31 (-32 - -30) 11.0-13.2 Bulk gyttja Flett Research 30.27 ± 0.63 -23 (-25 - -22) 13.2-15.4 Bulk gyttja Flett Research 25.48 ± 0.55 -16 (-17 - -15) 15.4-18.6 Bulk gyttja Flett Research 19.88 ± 0.50 -7 (-9 - -6) 18.6-20.8 Bulk gyttja Flett Research 23.28 ± 0.47 8 (6 - 10) 20.8-21.9 Bulk gyttja Flett Research 19.57 ± 0.45 23 (20 - 25) 21.9-25.1 Bulk gyttja Flett Research 15.90 ± 0.44 30 (27 - 33) 25.1-26.2 Bulk gyttja Flett Research 12.35 ± 0.37 58 (52 - 63) 2 58.0-59.5 Charcoal CAMS 139054 120 ± 100 150 (3 - 406) 61.6-62.1 Plant remains CAMS 155252 165 ± 35 173 (3 - 283) *81.5-83.5 Charcoal CAMS 139055 230 ± 70 233 (3 - 456) *83.0-83.5 Bulk gyttja CAMS 139056 395 ± 30 466 (330 - 505) *116.0-117.5 Charcoal CAMS 139057 620 ± 70 601 (525 - 679) *116.5-117.0 Bulk gyttja CAMS 139058 750 ± 35 686 (659 - 731) 124.5-125.0 Bulk gyttja CAMS 155253 840 ± 30 746 (693 - 879) 155.0-156.5 Charcoal CAMS 139059 1010 ± 50 924 (798 - 1043) *191.0-191.5 Bulk gyttja CAMS 155254 1310 ± 30 1251 (1181 - 1291) *191.5-192.0 Charcoal CAMS 155255 1245 ± 45 1183 (1066 - 1274) 240.0-240.5 Bulk gyttja CAMS 159645 1810 ± 30 1752 (1637 - 1821) 290.0-290.5 Bulk gyttja CAMS 159646 1975 ± 30 1924 (1863 - 1989) 340.0-340.5 Bulk gyttja CAMS 159647 2375 ± 35 2410 (2344 - 2665) 380.0-380.5 Wood CAMS 155256 2495 ± 35 2580 (2392 - 2719) *423.5-424.0 Bulk gyttja CAMS 155257 2685 ± 35 2788 (2752 - 2855) *424.0-424.5 Charcoal CAMS 155258 2555 ± 35 2661 (2503 - 2747) 452.0-453.0 Charcoal CAMS 155259 2740 ± 70 2847 (2754 - 3032) 488.5-489.0 Bulk gyttja CAMS 155260 3045 ± 35 3269 (3147 - 3351) 3 530.0-530.5 Bulk gyttja CAMS 159648 3390 ± 30 3636 570.5-571.0 Bulk gyttja CAMS 159649 3805 ± 35 4194 (4092 - 4359) 605.5-606.0 Bulk gyttja CAMS 159650 4050 ± 30 4522 (4439 - 4777) 639.5-640.0 Bulk gyttja CAMS 155261 4245 ± 40 4825 (4647 - 4865) 680.5-681.0 Bulk gyttja CAMS 159651 4675 ± 35 5399 (5322 - 5567) 720.5-721.0 Bulk gyttja CAMS 159652 5175 ± 35 5933 (5794 - 5992) 763.5-764.0 Bulk gyttja CAMS 159653 5610 ± 40 6379 (6310 - 6476) (3565 - 3704) a CAMS: Center for Accelerator Mass Spectrometry, Lawrence Livermore National Laboratory, Livermore, CA, USA. b210 Pb activity, with standard deviation, or conventional radiocarbon years before present (CE 1950), with standard deviation. c See the Materials and Methods section for details on 210Pb modeling and calibration of 14C dates. *Indicates nearly-paired samples from bulk gyttja and concentrated charcoal. 4 Table S2 Spearman correlation coefficients for comparisons among δ13C, %C, C:N, and %BSi for three discrete time periods. Correlations significant at the P ≤ 0.05 level are bold, accounting for reduced sample sizes due to temporal autocorrelation (see the Materials and Methods section). %BSi %C -0.82 C:N -0.38 δ13C 0.69 1300 cal yr BP present δ13C C:N -0.68 0.67 -0.32 -- --- 2800–1300 cal yr BP %BSi -0.57 -0.70 -0.07 δ13C 0.42 0.49 -- C:N 0.79 -- -- %BSi 0.03 0.02 -0.03 δ13C C:N 0.05 0.69 0.12 --- Time period 4250–2800 cal yr BP -- 5 Fig. S1 Series-wide Spearman correlation coefficients (r) between selected biogeochemical variables from Chickaree Lake. Reported P-values account for reduced sample sizes due to temporal autocorrelation (see the Materials and Methods section). 6 Fig. S2 Pollen diagram for Chickaree Lake. Pollen was sampled at a median interval of 7.5 cm (~60 yr) in the upper 175 cm of the core and a median interval of 25 cm (~200 yr) below 175 cm. 7 Fig. S3 Biogeochemical time series for Chickaree Lake. Median sample resolution was ~130 yr for %BSi and ~5 yr for all other variables. 8 Fig. S4 Relationships between charcoal peak magnitude and proxy responses for lower severity/extra local fires. Pearson correlation coefficients (r) were calculated using the logtransformed peak magnitude of each fire event and mean residual response variable values ~0–20 yr (left column) and ~20–50 yr (right column) after each event. Compare to Fig. 6 in the main text. Bulk density is abbreviated by “BlkDens.” 9 Notes S1 Estimated measurement error for isotopic analysis. Analytical precision of isotopic measurements was evaluated using within-run and betweenrun standard deviations from repeat analysis of a lake sediment standard and laboratory standards at the Idaho Stable Isotopes Laboratory, University of Idaho (UI), and the Stable Isotope Core Laboratory, Washington State University (WSU). Accuracy was assessed by calculating the mean difference between observed and known values for standards calibrated with internationally distributed reference materials. Error associated with sediment subsampling was evaluated by analyzing replicates taken from the same samples. The mean within-run standard deviation for the sediment standard was 0.07‰ for δ13C and 0.14 ‰ for δ15N at UI (n = 12 runs) and 0.04‰ for δ13C and 0.17‰ for δ15N at WSU (n = 4 runs). The between-run standard deviation for mean lake sediment standard values was 0.09‰ for δ13C and 0.22‰ for δ15N at UI (n = 12) and 0.02‰ for δ13C and 0.12‰ for δ15N at WSU (n = 4). The mean within-run standard deviation for acetanilide lab standards was 0.07‰ for δ13C and 0.08‰ for δ15N at UI and 0.08‰ for δ13C and 0.21‰ for δ15N at WSU. Accuracy was 0.05‰ for δ13C and 0.19‰ for δ15N at UI and 0.09‰ for both δ13C and δ15N at WSU. The mean sediment subsampling standard deviation was 0.11‰ for δ13C and 0.12‰ for δ15N (mean of five sets of n = 4 replicates; run at UI). 10 Notes S2 Additional results supporting interpretation of biogeochemical variables. Interpretation of lake-sediment biogeochemical records requires knowledge about the provenance of organic matter, an understanding of the processes controlling sediment composition, and confidence that primary trends were not obscured by post-depositional degradation. In the Chickaree Lake record, high organic matter concentration (%LOI550), the strong correlation between %C and %N, an absence of persistent down-core trends, and the infrequency of unexplained, strong correlations between isotopic composition and %C, %N, or C:N (Table S2, Figs S1, S3) suggest that sediment organic matter was relatively wellpreserved and subject to minimal systematic diagenetic degradation of labile material, possibly due to rapid burial under anoxic conditions (Hodell & Schelske, 1998; Meyers & Lallier-Verges, 1999; Lehmann et al., 2002; Galman et al., 2008; Galman et al., 2009). A weak correlation between %C and %N could indicate preferential degradation of N-enriched organic matter, and a strong positive correlation between C:N and δ15N may be caused by preferential losses of 14N under oxic conditions (Lehmann et al., 2002) – but these relationships were not evident in the Chickaree record (Fig. S1). Thus, we conclude that diagenetic changes likely did not obscure biogeochemical signals of organic matter source or fire impacts. Sediment δ15N values lower than those typical of algae (which take up 15N-enriched dissolved inorganic N [DIN] ), and a weak negative correlation between δ15N and %N (Fig. S1), are consistent with regulation of sediment isotopic composition by dissolved organic N (DON) derived from the isotopically depleted forest floor (Högberg, 1997; Meyers & LallierVerges, 1999; Michalzik et al., 2001; Bunting et al., 2010). DON accounts for most hydrologic N losses from many undisturbed temperate forests (e.g., Perakis & Hedin, 2002; Vanderbilt et al., 2002). Work by Bunting et al. (2010) demonstrated that terrestrial DON inputs strongly influenced N cycling and sediment δ15N in a series of subalpine lakes in the Canadian Rockies. Mean Chickaree Lake sediment δ15N (0.96 ‰) was similar to sediment δ15N values of Canadian Rockies lakes where DON accounted for > 75% of lake N (mean, 11 0.97‰, SD, 1.5‰). Mean Chickaree sediment C:N (14.9) was considerably higher than the typical C:N of algal organic matter (~4–10; Meyers & Lallier-Verges, 1999) and similar to the sediment C:N of subalpine lakes receiving significant terrestrial organic matter inputs (14.8; 14.1 ; Wissmar et al., 1977; Bunting et al., 2010). However, high terrestrial organic matter C:N values in Rocky Mountain subalpine forests (~25–70; Fahey et al., 1985; Baron et al., 2000) suggest that allochthonous inputs did not dominate Chickaree Lake sediment organic matter. Rather, sediment composition was also strongly influenced by algal productivity, further evidenced by high BSi concentration and correlations among proxies (Fig. S1, Table S2). For example, negative correlations between BSi and both C:N and %C (Fig. S1, Table S2) indicate that algal organic matter tended to reduce C:N while diatom remains diluted organic matter derived from non-siliceous algae and/or terrestrial sources. The imprint of algal productivity was also apparent in sediment isotopic composition. Algal discrimination against 15N and 13C tends to subside as DIN and dissolved inorganic C (DIC) stocks are depleted during periods of high aquatic productivity, leading to isotopic enrichment of algal biomass (e.g., Hollander & McKenzie, 1991; Hodell & Schelske, 1998; Teranes & Bernasconi, 2000). In the Chickaree record, a positive correlation between BSi and δ15N (Fig. S1) suggests that elevated algal productivity periodically led to isotopic enrichment of sediment organic matter. Productivity-induced 13C enrichment was most evident between ~1300 cal yr BP and present, when δ13C was positively correlated with BSi and negatively related to C:N and %C (Table S2). Positive correlations between δ13C and C:N in other sections of the core (e.g., ~2800 to 1300 cal yr BP; Table S2) indicate periods when withinlake C respiration likely depressed DIC δ13C, resulting in autochthonous organic matter that was isotopically depleted relative to terrestrial plants (Rau, 1978; LaZerte, 1983). All δ13C values fall within the range characteristic of both algal organic matter and temperate forest vegetation (Fig. S3; Meyers & Lallier-Verges, 1999). 12 References Baron JS, Rueth HM, Wolfe AM, Nydick KR, Allstott EJ, Minear JT, Moraska B. 2000. Ecosystem Responses to Nitrogen Deposition in the Colorado Front Range. Ecosystems 3: 352-368. Bunting L, Leavitt PR, Weidman RP, Vinebrooke RD. 2010. Regulation of the nitrogen biogeochemistry of mountain lakes by subsidies of terrestrial dissolved organic matter and the implications for climate studies. Limnology and Oceanography 55: 333-345. Fahey TJ, Yavitt JB, Pearson JA, Knight DH. 1985. The nitrogen cycle in lodgepole pine forests, southeastern Wyoming. Biogeochemistry 1: 257-275. Galman V, Rydberg J, Bigler C. 2009. Decadal diagenetic effects on δ13C and δ15N studied in varved lake sediment. Limnology and Oceanography 54: 917-924. Galman V, Rydberg J, de-Luna SS, Bindler R, Renberg I. 2008. Carbon and nitrogen loss rates during aging of lake sediment: Changes over 27 years studied in varved lake sediment. Limnology and Oceanography 53: 1076-1082. Hodell DA, Schelske CL. 1998. Production, sedimentation, and isotopic composition of organic matter in Lake Ontario. Limnology and Oceanography 43: 200-214. Högberg P. 1997. 15N natural abundance in soil-plant systems. New Phytologist 137: 179203. Hollander DJ, McKenzie JA. 1991. CO2 control on carbon-isotope fractionation during aqueous photosynthesis: A paleo-pCO2 barometer. Geology 19: 929-932. LaZerte BD. 1983. Stable carbon isotope ratios: Implications for the source of sediment carbon and for phytoplankton carbon assimilation in Lake Memphremagog, Quebec. Canadian Journal of Fisheries and Aquatic Sciences 40: 1658-1666. Lehmann MF, Bernasconi SM, Barbieri A, McKenzie JA. 2002. Preservation of organic matter and alteration of its carbon and nitrogen isotope composition during simulated and in situ early sedimentary diagenesis. Geochimica et Cosmochimica Acta 66: 3573-3584. Meyers PA, Lallier-Verges E. 1999. Lacustrine sedimentary organic matter records of Late Quaternary paleoclimates. Journal of Paleolimnology 21: 345-372. Michalzik B, Kalbitz K, Park JH, Solinger S, Matzner E. 2001. Fluxes and concentrations of dissolved organic carbon and nitrogen: a synthesis for temperate forests. Biogeochemistry 52: 173-205. 13 Perakis SS, Hedin LO. 2002. Nitrogen loss from unpolluted South American forests mainly via dissolved organic compounds. Nature 415: 416-419. Rau G. 1978. Carbon-13 depletion in a subalpine lake: Carbon flow implications. Science 201: 901-902. Teranes JL, Bernasconi SM. 2000. The record of nitrate utilization and productivity limitation provided by δ15N values in lake organic matter--a study of sediment trap and core sediments from Baldeggersee, Switzerland. Limnology and Oceanography 45: 801-813. Vanderbilt KL, Lajtha K, Swanson FJ. 2002. Biogeochemistry of unpolluted forested watersheds in the Oregon Cascades: Temporal patterns of precipitation and stream nitrogen fluxes. Biogeochemistry 62: 87-117. Wissmar RC, Richey JE, Spyridakis DE. 1977. The importance of allochthonous particulate carbon pathways in a subalpine lake. Journal of the Fisheries Research Board of Canada 34: 1410-1418.
