SP 7.3 Unpacked Outcome
advertisement
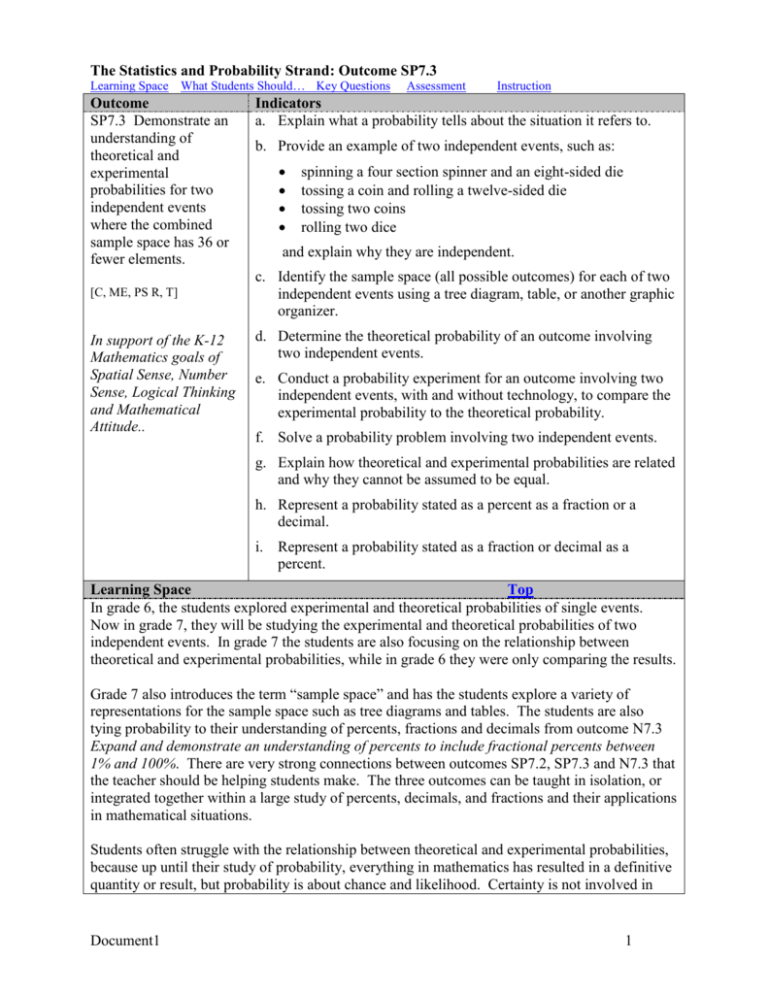
The Statistics and Probability Strand: Outcome SP7.3 Learning Space What Students Should… Key Questions Outcome SP7.3 Demonstrate an understanding of theoretical and experimental probabilities for two independent events where the combined sample space has 36 or fewer elements. [C, ME, PS R, T] In support of the K-12 Mathematics goals of Spatial Sense, Number Sense, Logical Thinking and Mathematical Attitude.. Assessment Instruction Indicators a. Explain what a probability tells about the situation it refers to. b. Provide an example of two independent events, such as: spinning a four section spinner and an eight-sided die tossing a coin and rolling a twelve-sided die tossing two coins rolling two dice and explain why they are independent. c. Identify the sample space (all possible outcomes) for each of two independent events using a tree diagram, table, or another graphic organizer. d. Determine the theoretical probability of an outcome involving two independent events. e. Conduct a probability experiment for an outcome involving two independent events, with and without technology, to compare the experimental probability to the theoretical probability. f. Solve a probability problem involving two independent events. g. Explain how theoretical and experimental probabilities are related and why they cannot be assumed to be equal. h. Represent a probability stated as a percent as a fraction or a decimal. i. Represent a probability stated as a fraction or decimal as a percent. Learning Space Top In grade 6, the students explored experimental and theoretical probabilities of single events. Now in grade 7, they will be studying the experimental and theoretical probabilities of two independent events. In grade 7 the students are also focusing on the relationship between theoretical and experimental probabilities, while in grade 6 they were only comparing the results. Grade 7 also introduces the term “sample space” and has the students explore a variety of representations for the sample space such as tree diagrams and tables. The students are also tying probability to their understanding of percents, fractions and decimals from outcome N7.3 Expand and demonstrate an understanding of percents to include fractional percents between 1% and 100%. There are very strong connections between outcomes SP7.2, SP7.3 and N7.3 that the teacher should be helping students make. The three outcomes can be taught in isolation, or integrated together within a large study of percents, decimals, and fractions and their applications in mathematical situations. Students often struggle with the relationship between theoretical and experimental probabilities, because up until their study of probability, everything in mathematics has resulted in a definitive quantity or result, but probability is about chance and likelihood. Certainty is not involved in Document1 1 either the theoretical or the experimental probabilities, and students must be engaged in regular reflection on this idea. Often students think that the theoretical probability is what must happen. It is important that the students are regularly engaged in learning activities that cause them to reflect upon this notion. If using technology, the size of the sample space can be expanded, but it is important to remember that the students are only to be assessed on probabilities with a sample space of up to 36 elements. Otherwise, if the size of the sample space becomes larger, the students’ focus moves to the mechanics of constructing the sample space rather than staying on the development of their understanding of probability in general. Probability experiments can be developed around any context that occurs in the students’ daily lives. It is important that along with the traditional use of dice, coins, and cards that the students be engaged in probabilities that are directly related to their lives. Statistics and data emerge in every subject area the students encounter, as well as in their recreational activities. These statistics should be used as a basis for reflection by the students, as well as to stimulate ideas for contexts for determining experimental probabilities. In all situations, students should regularly be asked what a given or calculated probability tells them about the situation, and what it implies about other situations. What Students Should… Know The terms theoretical probability, experimental probability, and sample space. Document1 Top Understand Be Able to Do The difference between Determine the theoretical theoretical and experimental probability for two probability and how they independent events (with up are related. to 36 possible outcomes). Just because an element is Design and carry out (with in the sample space does and without technology) not guarantee that it will experiments to determine ever occur. the experimental probability of two independent events Why a theoretical (with up to 36 possible probability of two outcomes). independent events involves the multiplication of the two Represent the sample space individual theoretical for two independent events. probabilities. Rewrite probabilities as percents, fractions, or Why an experimental probability may never equal decimals. the theoretical probability. Solve problems involving Why a high probability the probability of two does not guarantee a independent events. particular outcome will Identify events that are happen or why a low independent. probability does not guarantee that a particular outcome will not happen. 2 A probability can be expressed as a fraction, decimal or percent and that any of the three formats represents the same likelihood or chance of the outcome occurring. Probability is a measure of likelihood and not of actuality. What makes two events independent. Explain why the total of the probabilities for all possible outcomes must be 100%. Key Questions Top What does probability tell you? What is the difference between theoretical and experimental probability? What does it mean for events to be independent? Why is multiplication used to determine probabilities to two independent events? How can you determine the number of possible outcomes when there are two independent events? Suggestions for Assessment Top Big Idea: Sample space. Representation of probability. Theoretical versus experimental probability. Suggestions for assessment tasks: 1. Have the students design a task in which they can determine the theoretical and experimental probability of two independent events. Encourage the students to consider original contexts that are relevant to them. If they choose a context in which the sample space is greater than 36, remember that the expectation for this outcome is just to 36, so look for understanding rather than total accuracy in such cases. Within their task, they will need to represent the sample space, design and carry out an experiment, determine the experimental and theoretical probability for a particular outcome, record the probabilities in percent, fraction, and decimal form, and write an explanation of what the probability tells them about the particular outcome. As a class, a rubric or checklist for assessing the content of completed tasks can be created and used in conjunction with any or all of the included rubrics. What to look for: See Sample Space Rubric. See Representation of Probability Rubric. See Theoretical Versus Experimental Probability Rubric. Document1 3 Suggestions for Instruction: Top Big Idea: Sample space. Representation of probability. Theoretical versus experimental probability. Suggestions for instructional activities 1. Begin by asking the class to discuss what probability means to them and where they have heard the word used. Have the students research some of these uses of the word to find out exactly what the probability that they have heard means. For example, the probability of precipitation is often misunderstood. It actually is a measure of the likelihood that on 100 identical days (same types of conditions – air pressure, wind, temperature…) that some form of precipitation will very likely occur in that region. Many people believe that it means that if the probability of precipitation is 40%, it should rain for 40% of the day. Others believe that if the probability of rain is 20% that flooding won’t happen. The probability of precipitation does not have either of these interpretations. (If available, have the students watch and discuss the video Of Dice and Men by the National Film Board.) Have the students record their ideas of probability in their journal. 2. Carry out a concept attainment activity with the students to develop the concept of independent events. To do this, make pairs of events that the students can relate to – some of which are independent and some of which are not. Start by putting a few examples under YES or NO, then ask the students to vote where the next example should go. Tell the students to not state their reasoning out loud at this point, but just vote (thumbs us – YES, thumbs down – NO, thumbs sideways – unsure). Put the unsure events to one side and continue to give examples. If you feel that the students are picking up a characteristic that is not correct, place an example specifically in its column to demonstrate the misunderstanding. Eventually, ask the students to justify why they want an example to go in a particular set. Let the students discuss the ideas presented, and also to place some of the items they previously classified as unsure. Note: an interesting consequence of this activity is that the students might not have the same experiences as the teacher, so they may interpret events differently. For example, the two events might be going by car to school and going by bus to school. For some students they may actually do both – even in the same day. These ideas will also emerge through the discussion, highlighting the importance of understanding the intended context in probability situation. 3. Give pairs of students two events that are to happen together (for example rolling a die and tossing a coin, drawing a marble and spinning an spinner – be sure to define the conditions – six-sided die, 14 marbles comprised of marbles of 4 different colours…). Ask the students to individually list all the possible outcomes for the given situation, and then have the pairs share their results and strategies. Have the pairs come to consensus about all the possible outcomes and then group the pairs together to compare their results. When the groups of four have come to consensus, have each group present their results (and add to the previous group’s results if possible) and at least one strategy they used. Repeat this activity with the students choosing the scenarios and defining the sample space. Have the groups present their scenario and sample space to the class. It is at this point that the actual term “sample space” Document1 4 should be introduced – prior to this time, the list should be described as “all possible outcomes of the events occurring”. If the students have missed a major strategy (such as a tree diagram or table) be sure to illustrate how it would look for one of their scenarios. 4. Ask the students to determine the probability of a particular outcome or set of outcomes from the sample space of the first pair of events that they found. Have the students discuss their results and what they did to obtain them. Have the students connect their work to their definition of probability. 5. Have the students develop two or three probability questions based on the scenarios that they created and answer them using their sample space. Next, have the students trade questions with another group, but without providing the sample space. 6. Select one of the scenarios and probabilities from 5, and have the students discuss what the probabilities tell them. Ask the students if the scenario was to be actually carried out what the results would be. Ask the students how they could check if what they predicted was true. Have the students carry out an experiment and determine the probability for the particular outcome using those results. Have each student or pair of students report their results for this new probability and as a class compare it to the probability determined in #5. Have the students talk about why the probabilities are (likely) all different when they are supposed to answer the same question. Debrief this activity and explain that while #5 was working with theoretical probabilities, #6 was working with experimental. Ask the students to write about experimental and theoretical probabilities in their journal, explaining the differences and relationship between them. 7. Have each of the students flip a coin repetitively until they have achieved a probability of 1/2 for chance of getting a heads. Have the students report their results, and as a class discuss why all the different number of flips were needed. Also ask the students what they think the maximum number of flips that would be needed before the experiment showed that the probability of heads was ½. 8. As a homework task, tell the students that they are going to be considering the flipping of two coins. Ask the students what they think are the two different events in this scenario and whether or not the events are independent or not. Have the students create the sample space to represent all possible outcomes for flipping two coins, and ask them to determine the theoretical probability of flipping two heads in this scenario. Next, have the students carry out an experiment with 30 – 50 trials to determine the experimental probability of flipping two heads. Next class, have the students share, compare, and discuss their results and then write about their understandings of probability in their journals. Students may also wish to create posters, videos, or a dramatic presentation to capture their understanding. 9. Give the students the probability for each of two independent events and ask them to determine the probability of the two independent events happening. Have the students share their strategies, referring back to past problems and new insights that they have regarding independent events and mathematical operations. Document1 5
