Probability - Dordt College Homepages
advertisement
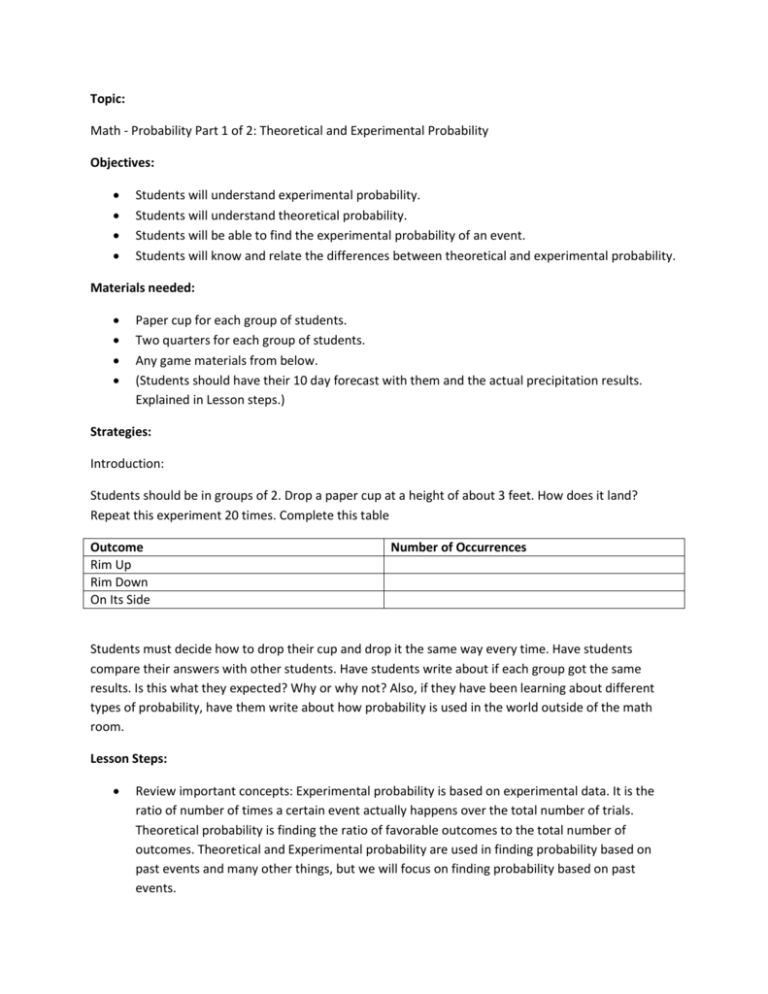
Topic: Math - Probability Part 1 of 2: Theoretical and Experimental Probability Objectives: Students will understand experimental probability. Students will understand theoretical probability. Students will be able to find the experimental probability of an event. Students will know and relate the differences between theoretical and experimental probability. Materials needed: Paper cup for each group of students. Two quarters for each group of students. Any game materials from below. (Students should have their 10 day forecast with them and the actual precipitation results. Explained in Lesson steps.) Strategies: Introduction: Students should be in groups of 2. Drop a paper cup at a height of about 3 feet. How does it land? Repeat this experiment 20 times. Complete this table Outcome Rim Up Rim Down On Its Side Number of Occurrences Students must decide how to drop their cup and drop it the same way every time. Have students compare their answers with other students. Have students write about if each group got the same results. Is this what they expected? Why or why not? Also, if they have been learning about different types of probability, have them write about how probability is used in the world outside of the math room. Lesson Steps: Review important concepts: Experimental probability is based on experimental data. It is the ratio of number of times a certain event actually happens over the total number of trials. Theoretical probability is finding the ratio of favorable outcomes to the total number of outcomes. Theoretical and Experimental probability are used in finding probability based on past events and many other things, but we will focus on finding probability based on past events. Students should return to their groups of two. Have them find the experimental probability of the cup landing rim down based on their records. Each group will have a different answer. (Even though it is impossible to calculate theoretical probability, this is just an activity for them to get their minds thinking about experimental probability with a hands-on activity.) Then students should flip two coins. Have them record the number of times they have one head/one tail, two heads, or two tails. Record 20 different trials. Have students figure out the experimental probability that the next toss would produce each option. This can be calculated by number of times the toss produced each option over the total number of tosses. Theoretical probability can be made from a tree diagram that the students have already learned. o For the coins o Coin 1 ---- H Theoretical Probability ---- T of 1 H, 1 T = 2/4 = 50% o Coin 2 ---- H of 2 H = ¼ = 25% ----- T of 2 T = ¼ = 25% Have the students talk with their partner about why their experimental probability is different than the theoretical probability (the theoretical is the likely occurrence and experimental is the actual outcome.) and how they could decrease this gap. (With more trials.) The greater the number of trials, the more likely the probability will be closer to the theoretical probability. o Together, compile the class total of results for a more accurate ratio. The ratio should be closer than individual ratios to the theoretical probability. Have each student write down their name on a small piece of paper and put it into a cup or hat. Have students write down their theoretical probability of choosing a boys’ name from the class randomly. Find the experimental probability by choosing 20 different names. Make sure names are returned to the hat after each draw and shaken through equally each time, otherwise the probability is altered. Remind students that probabilities range from 0-1. A 0 is an impossible event. .5 (50%) is equally likely or unlikely event. 1 represents a certain event. A complement is the opposite probability of an event. So the complement to the name experiment is the probability of drawing a girls’ name. o The probability of a boys’ name + the probability of a girls’ name = 1 (100%) o Have students come up with a list of other complements. (an event or not an event, rolling a 3 or not rolling a three, heads or tails, etc.) Have students write about what they think it means to say the odds are. o It means the ratio of the number of favorable outcomes to the number of unfavorable outcomes. o With a bag of marbles containing 4 red ones, 3 orange ones, and one yellow, what are the odds of picking a red? ( 1:1) o What are the odds of picking a color other than orange? ( 5:3) o Put together a bag so that the odds of picking a green marble are 7:5. (7 green and 5 other colors.) Have students read the article in USA today found at this link: http://www.usatoday.com/weather/wforund.htm. There is one section that mentions probability and another with the odds. Have students comment on those two sections and how probability is related. Also have them comment on two other interesting sections from this website. Finally, students will use a 10 day forecast of precipitation. They were to look up a ten day forecast of some area from out of town where they know someone that lives there. Each day they had to find out if it actually rained or snowed that day. As a class, we want a variety of places to calculate probabilities. An example is given here: o Students will record the forecast for precipitation. The next 10 days has 50%, 30%, 10%, 20%, 20%, 20%, 20%, 20%, 20%, 0%. o Students will change the percentage to ratio probabilities ½, 3/10, 1/10, 2/5…0 o Then students will calculate the theoretical probabilities of precipitation for different combinations by multiplying the probabilities together: Raining tomorrow: 50% Raining both tomorrow and the following day: ½ x 3/10 = 3/20 = 15% Raining all ten days: 0% Can do many other combinations. o Then together as a class, we will calculate theoretical and experimental probabilities. Multiply any combination of days with the entire class. Raining tomorrow: Multiply all the probabilities together. That would mean that there was a __% probability that it would precipitate in all places. Then students should raise their hand for if their town did have precipitation that day. They should see a correlation with higher probabilities and more hands raised. This does not entirely explain experimental probabilities, but helps the kids understand the weather forecasts and probabilities a little more. If time, o Another website that would be fun for the students is about probability and games. Use this website and page 19 is the important section. Use any ideas or materials from here: http://www2.edc.org/mathpartners/pdfs/6-8%20Statistics%20and%20Probability.pdf o This website also offers another probability game for students to use: http://illuminations.nctm.org/LessonDetail.aspx?id=L585 Assignment: Students will use their weather histogram information and create probabilities. What is the experimental probability of each interval on their graph? Students could also complete problems from a textbook if available. A suggestion would be Middle Grades Math: Tools for Success Course 3, page 568. Rubric: Category Level 1: Minimal Competency Level 2: Basic Competency Level 3: Advanced Competency Calculations Has hardly any calculations correct. Shows no work. Has many correct calculations. Has most of the calculations correct. Shows most of the necessary work. Work Shows minimal work. Level 4: Outstanding Competency Has all of the calculations correct. Shows all necessary work. Evaluation: Students will show competency in understanding experimental and theoretical probability through the in class work and discussions. Through the assignment, with both correct answers and work, students will show competency in finding the theoretical and experimental probabilities.
