Elementary Statistics
advertisement
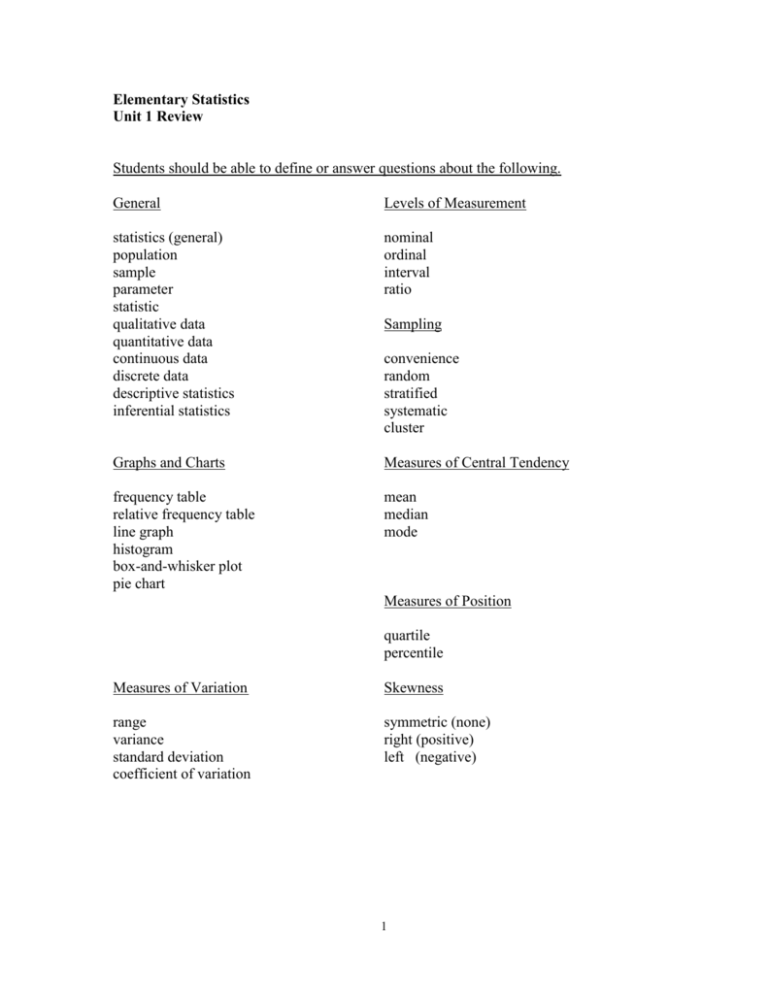
Elementary Statistics Unit 1 Review Students should be able to define or answer questions about the following. General Levels of Measurement statistics (general) population sample parameter statistic qualitative data quantitative data continuous data discrete data descriptive statistics inferential statistics nominal ordinal interval ratio Graphs and Charts Measures of Central Tendency frequency table relative frequency table line graph histogram box-and-whisker plot pie chart mean median mode Sampling convenience random stratified systematic cluster Measures of Position quartile percentile Measures of Variation Skewness range variance standard deviation coefficient of variation symmetric (none) right (positive) left (negative) 1 Elementary Statistics Unit 1 Review Histogram Most popular display. Can be used at any level of measurement. Easiest to understand. Is not a good descriptive measure when comparing more than one variable. Line Graph (Frequency Polygon) Common display. Use with continuous data. Good for multiple comparisons. Shows increases and decreases well. Pie Chart or Circle Graph Use only with nominal level data. 2 Box Plots are used for multiple comparisons. need some explanation of how to interpret. Mean is appropriate at the interval or ratio level of measurement. is greater than the median in a skewed right distribution. is less than the median in a skewed left distribution. is not appropriate when outliers exist is the most common measure of central tendency Median is appropriate at the ordinal, interval, and ratio level of measurement. is equal to the 50th percentile. is not sensitive to outliers Mode is appropriate at any level of measurement. is usually not an accurate measure of central tendency. should only be used at the nominal level. Range is easy to understand is influenced by outliers uses only two data values to compute Variance takes every data value into account is not commonly used as a descriptive measure of variability Standard Deviation is the square root of the variance is the most common descriptive measure of variability is not easily understood by the general public 3
