On the matter of global climate change, I have been pondering facts
advertisement
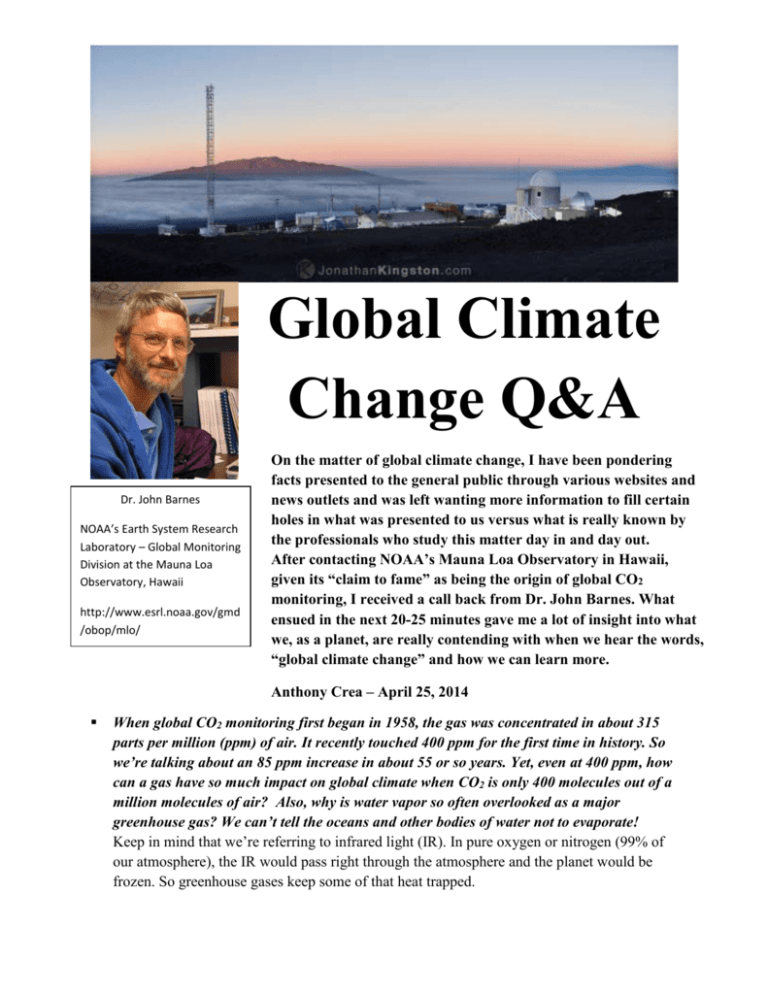
Global Climate Change Q&A Dr. John Barnes NOAA’s Earth System Research Laboratory – Global Monitoring Division at the Mauna Loa Observatory, Hawaii http://www.esrl.noaa.gov/gmd /obop/mlo/ On the matter of global climate change, I have been pondering facts presented to the general public through various websites and news outlets and was left wanting more information to fill certain holes in what was presented to us versus what is really known by the professionals who study this matter day in and day out. After contacting NOAA’s Mauna Loa Observatory in Hawaii, given its “claim to fame” as being the origin of global CO2 monitoring, I received a call back from Dr. John Barnes. What ensued in the next 20-25 minutes gave me a lot of insight into what we, as a planet, are really contending with when we hear the words, “global climate change” and how we can learn more. Anthony Crea – April 25, 2014 When global CO2 monitoring first began in 1958, the gas was concentrated in about 315 parts per million (ppm) of air. It recently touched 400 ppm for the first time in history. So we’re talking about an 85 ppm increase in about 55 or so years. Yet, even at 400 ppm, how can a gas have so much impact on global climate when CO2 is only 400 molecules out of a million molecules of air? Also, why is water vapor so often overlooked as a major greenhouse gas? We can’t tell the oceans and other bodies of water not to evaporate! Keep in mind that we’re referring to infrared light (IR). In pure oxygen or nitrogen (99% of our atmosphere), the IR would pass right through the atmosphere and the planet would be frozen. So greenhouse gases keep some of that heat trapped. I apologized for interrupting, but I told Dr. Barnes I understood this already, given my job. Acknowledging this, he began to address the water vapor component more in-depth. Water vapor is a major greenhouse gas, and its concentration (at about 10,000 – 20,000 ppm) is much greater than CO2 (at around 400ppm). However, CO2 has a doubling effect on the water vapor meaning that the warming caused by CO2 amplifies the warming effect of water vapor. So, even comparing just CO2 and water vapor, it seems that 400 ppm is still a lot smaller than 10,000 or 20,000 ppm. But it is important to remember that there is a delicate balance with the effects of all of this. Most notable is the ice melting in the Arctic. 35% of the ice has melted from an area about the size of Alaska. One day soon ships will be able to sail the fabled Northwest Passage through the Arctic [year round]. Now, for comparison, ozone (O3) and how we measure its depletion from CFC’s [chlorofluorocarbons] is measured in parts per trillion (ppt)! Mentioning that we’ve covered the ozone issue as well in my classes, I asked Dr. Barnes if he agreed that headway was made on remedying this issue and can it be considering one of the few environmental issues we’ve actually begun to fix. I agree that headway was made. In 5 years’ time it will be safe to say that ozone is recovering [as opposed to still being destroyed] and in 50 years we will be back to pre-damage levels. One of the ongoing debates is whether global climate change is exclusively a man-made (anthropogenic) issue or simply part of a natural variation in cycles based on the sun. Can you pin a number as to what percentage is anthropogenic versus naturally occurring? I won’t pin numbers on man versus natural cycle, but one of the predictions that global climate change would cause is greater hurricane strength. That’s a poor statistic and we haven’t really seen that. We still believe the ice melting is the biggest indicator. However, we do measure the sun pretty well. We know the sun has 11 year cycles and thus far it has only shown a 1/10% change in output. Also, greenhouse gas forcing [refers to a balance between incoming and outgoing radiative energy] is small as well; but again, it is a delicate balance. Actually, over the last few months we have discovered through data that there has been a lack of warming over the last 10 years... It plateaued. In particular, the oceans haven’t warmed at the surface; rather there has been deep-ocean warming due to circulation changes. The upwelling of cooler water from down below has caused the atmosphere to cool. At this point I referenced how the general public was led to believe the doom and gloom of “An Inconvenient Truth” (2006). I asked Dr. Barnes why much of the info he shared with me thus far countered what was presented in the movie, especially regarding the overall warming of the planet. There was still warming when the film was made. It hadn’t plateaued at that point. I asked Dr. Barnes how and where he felt we (as a global society) needed to be going with energy production, transportation, etc. I referenced how coal and nuclear pack an enormous punch when used as fuels in a power plant and how we would need many, many, many solar panels or windmills to equal the output of one large coal-fired or nuclear-fueled power plant. Additionally, I asked him when he thought we’d move from current Plan “A” methods to Plan “B” methods where we use renewables and alternative technologies. While Dr. Barnes understood the question and thought it was a good one, he stated that we were now heading into personal opinion and he really doesn’t share that. I respected his privacy on the matter but he did share this… Regarding our future, we need to think in 20 year timeframes. To transition to a post-carbon society we need to do this in 20 year increments. Realizing that most other questions in my head were now leaning towards hearing his opinion, I began to wrap up the call, it helped that Dr. Barnes was going to be giving a tour of the observatory in a little while as well! But, I stated that it’s a shame he wasn’t closer because I’d love to learn more from him and have my students meet him and see the work he does. He countered with some really cool information… Since you are in NJ, are you near Princeton University? [I told him we are maybe 15 miles away] Were you aware NOAA has a lab in Princeton? It’s called the Geophysical Fluid Dynamics Laboratory (GFDL) and they create all the supercomputer models for climate there. Contact their community relations / outreach person and see if you can arrange something with them. I thanked Dr. Barnes for his time and for all the information he shared with me. I then began looking up and reading about NOAA’s GFDL at Princeton. Stay tuned… http://www.gfdl.noaa.gov/


