Electronic Supplementary Material Table S1 Sources of interview
advertisement
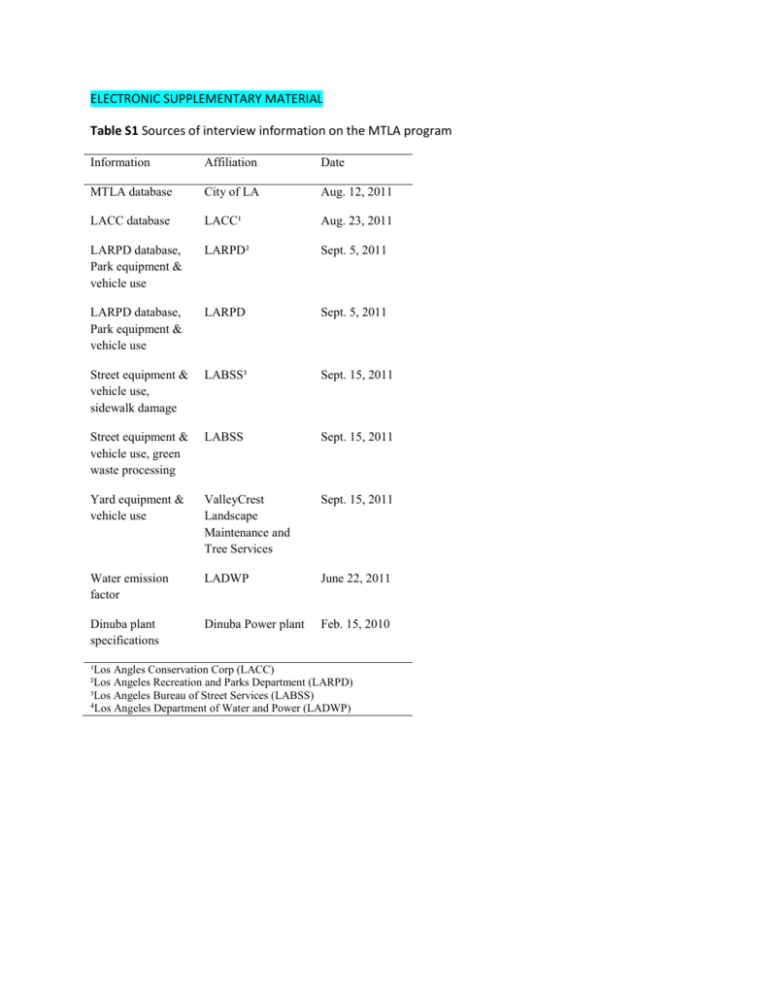
ELECTRONIC SUPPLEMENTARY MATERIAL Table S1 Sources of interview information on the MTLA program Information Affiliation Date MTLA database City of LA Aug. 12, 2011 LACC database LACC¹ Aug. 23, 2011 LARPD database, Park equipment & vehicle use LARPD² Sept. 5, 2011 LARPD database, Park equipment & vehicle use LARPD Sept. 5, 2011 Street equipment & vehicle use, sidewalk damage LABSS³ Sept. 15, 2011 Street equipment & vehicle use, green waste processing LABSS Sept. 15, 2011 Yard equipment & vehicle use ValleyCrest Landscape Maintenance and Tree Services Sept. 15, 2011 Water emission factor LADWP June 22, 2011 Dinuba plant specifications Dinuba Power plant Feb. 15, 2010 ¹Los Angles Conservation Corp (LACC) ²Los Angeles Recreation and Parks Department (LARPD) ³Los Angeles Bureau of Street Services (LABSS) 4Los Angeles Department of Water and Power (LADWP) Table S2 Emission factors (EF) for fuels (kg CO2/L) used in equipment (HP = horsepower) and vehicles. Fuel Type Equipment EF Gasoline Diesel Vehicle EF 2.319 0.150 2.689 Gasoline & Oil Gasoline 2-stroke (0-25 HP) 0.113 Gasoline 4-stroke (0-50 HP) 0.113 Gasoline 4-stroke (50-120 HP) 0.207 2 % Biodiesel 2.499 Table S3 Equipment used for tree planting and care activities (HP=horsepower, LF = Load Factor) Street - Type HP LF Fuel Activities1 Concrete saw 6.5 0.78 Gasoline PL Compressor 12 0.56 Gasoline PL Chain saw 2 0.7 Gasoline /oil PR, RM, SW Chipper 115 0.43 Diesel PR, RM, SW Stump grinder 77 0.78 Gasoline RM Concrete grinder 6.5 0.78 Gasoline SW Generator 12 0.43 Gasoline SW Loader 148 0.21 Diesel SW Root pruner 85 0.43 Diesel SW Loader 259 1,600 hr/yr Diesel PL, SW Screener 265 1,500 hr/yr Diesel PL, SW Crusher 300 1,500 hr/yr Diesel PL, SW Tub grinder 1000 2,600 hr/yr Diesel PR, RM, SW Chain saw 0.5 and 2 0.7 Gasoline /oil PR Chain saw 2 and 3 0.7 Gasoline /oil RM Chipper 80 0.43 Diesel PR, RM Stump grinder 140 0.43 Diesel RM Tub grinder 1000 2,600 hr/yr Diesel PR, RM Chain saw 2.1 0.7 Gasoline /oil PR, RM Chipper 125 0.43 Diesel PR, RM Stump grinder 27 0.78 Gasoline RM Tub grinder 1000 2,600 hr/yr Diesel RM Park - Type Yard - Type 1PL = plant, ES = establishment, PR = prune, RM = remove, SW = sidewalk repair Table S4 Vehicles used for tree planting and care activities Street - Type litre 100 km¹ km/tree Fuel Activities1 Chevy 2500 15.7 1.93 Gasoline PL Ford F-450 19.9 6.44 Gasoline PL Ford F-450 19.9 9.66 Gasoline PL Ford F-450 19.9 0.97 Gasoline ES Chevy C7 29.4 4.02 Gasoline PR, SW Chevy 2500 15.7 4.02 Gasoline PR, SW Chevy C7 29.4 16.09 Gasoline PR, RM, SW Kenworth 58.8 Diesel PR, RM, SW Chevy 2500 15.7 16.09 Gasoline RM Chevy C7 29.4 1.61 Gasoline SW Chevy 2500 15.7 1.61 Gasoline SW Freightliner 47.0 16.09 Diesel SW Ford F-350 19.6 3.22 Gasoline PL, ES GMC C7H042 29.4 1.61 Diesel PL, ES Private vehicles 7.8 0.00 Gasoline PL, ES Park - Type Kenworth 58.8 PR, RM GMC CC4E042 26.1 32.19 Gasoline PR, RM GMC C7H042 29.4 32.19 Diesel PR, RM Ford F-450 19.9 4.51 Gasoline PL Ford F-800 39.2 Diesel PR, RM Ford F-250 18.1 Gasoline PR, RM Yard - Type 1 13.68 PL = plant, ES = establishment, PR = prune, RM = remove, SW = sidewalk repair Table S5 Equations used to calculate CO2 emissions for equipment, vehicle and water Number Equation 1 AEE = ∑𝑛𝑖=1 = RTs, z x LFi x HPi x EFi AEE = annual equipment emissions RTs, z = hours of run-time (RT) for equipment type i per year for species s and location z LFs, z = typical load factor (LF) for equipment type i HPs, z = maximum horsepower (HP) for equipment type i EFs, z = emissions factor (CO2 emissions per horsepower-hour for fuel type (kg/HP-HR)) for equipment type i 2 VECi = (d / VFE) x EF VECi = vehicle emission constant for vehicle type i D = distance traveled between trees VFE = vehicle fuel efficiency for vehicle type i EF = emissions factor for fuel used by vehicle type i 3 AVE = ∑𝑛𝑖=1 = TLTs, z x VECj AVE = annual vehicle emissions TLTs, z = total live trees for species s and location z VECi = vehicle emission constant for vehicle type i 4 IWA = ETt x ETo / IEF IWA = irrigation water applied ETt = evapotranspiration (i.e., sum of water losses through evaporation from the soil and transpiration from the plant) ETo = reference evapotranspiration (i.e., water loss from a field of 10.2 to 17.8 cm tall cool season grass that is not water stressed) IEF = irrigation efficiency (i.e., portion of the total applied irrigation water used primarily to satisfy plant water needs, losses include runoff and evaporation from wet soil surfaces) 5 ETt = ks x CPAs x 0.62 gals/ft2 –inch ETt = evapotranspiration Ks = species coefficient (values range from 0.1 to 0.9) CPAs = crown projection area for species s (surface area under the tree’s dripline) 6 PHRs, z = PRTs, z x TLTs, z x PTPz x PPAz PHRs, z = total annual run-time (RT) hours for pruning species s at Street, Park or Yard location z PRTs, z = RT hours per tree to prune species s and location z with a given dbh TLTs, z = total live trees for species s and location z PTPz = percentage of live trees eligible to be pruned PPAz = percentage of eligible trees pruned annually 7 8 PDWs, z = ADWs, z x PTPz x PPAz x DWRz PDWs, z = total annual dry weight (DW) of aboveground woody biomass pruned for species s at Street, Park or Yard location z ADWs, z = total aboveground biomass for species s at Street, Park or Yard location z DWRz = percentage of aboveground woody biomass removed from each tree during pruning RHRs, z = HRTs, z x TDTs, z x PTRz x PRAz RHRs, z = total annual RT hours for removing species s at Street, Park or Yard location z HRTs, z = RT hours per tree to remove species s and location z with a given dbh TDTs, z = total dead trees for species s and location z PTRz = percentage of dead trees eligible to be removed at Street, Park or Yard location z PRAz = percentage of eligible trees removed annually at Street, Park or Yard location z 9 SHRs, z = HSTs, z x TDTs, z x PTSz x PSAz SHRs, z = total annual RT hours for stump grinding species s at Street, Park or Yard location z HSTs, z = RT hours per tree to grind stump of species s and location z with a given dbh TDTs, z = total dead trees for species s and location z PTRz = percentage of dead trees eligible to have stump ground at Street, Park or Yard location z PSAz = percentage of eligible trees to have stump ground annually at Street, Park or Yard location z 10 RDWs, z = ADW s, z x PTRz x PRAz RDWs, z = total annual DW of aboveground woody biomass removed annually for species s and location z ADWs, z = total aboveground biomass for species s at Street, Park or Yard location z PTRz = percentage of dead trees eligible to be removed at Street, Park or Yard location z PRAz = percentage of eligible trees removed annually at Street, Park or Yard location z Table S6 Estimated fuel inputs (kL) for equipment and vehicles in Street, Yard and Park locations over the 40-year period Street Petrol Street Petrol Street Diesel Cut Tree Well 7.3 Plant Park Petrol /Oil Park Petrol Park Diesel 23.1 0.0 0.0 17.1 0.0 0.0 Establish & Water 10.7 0.0 Subtotal 35.1 Prune & Chip Per Tree planted (L) /Oil Yard Petrol Yard Diesel Grand Total 0.0 0.0 0.0 0.0 30.4 0.3 2,183.3 0.0 0.0 20.8 0.0 2,221.2 24.2 0.0 6.1 0.0 0.0 0.0 0.0 16.8 0.2 23.1 0.0 2,183.3 0.0 0.0 20.8 0.0 2,268.4 27.4 54.5 54.1 1.7 145.7 218.0 0.6 19.4 112.4 606.5 6.6 Process Biomass 12.4 234.3 0.0 0.0 568.7 0.0 0.0 0.0 815.4 8.9 Distribute Mulch 0.2 0.0 0.0 0.4 0.0 0.0 0.0 0.0 0.7 0.0 Subtotal 67.2 288.4 1.7 146.1 786.7 0.6 19.4 112.4 1,422.5 15.5 Remove & Chip 185.6 268.0 10.1 36.5 69.0 1.2 5.2 143.0 718.5 7.8 Grind Stump 693.5 0.0 0.0 27.4 49.7 0.0 41.3 0.0 811.9 8.8 Process Biomass 110.5 2,200.0 0.0 0.0 223.6 0.0 0.0 36.0 2,570.1 28.0 Distribute Mulch 7.3 0.0 0.0 2.4 0.0 0.0 0.0 0.0 9.7 0.1 Subtotal 996.9 2,468.1 10.1 66.2 342.3 1.2 46.5 178.9 4,110.1 44.8 Plant Prune Remove Sidewalk Repair Grind 0.1 0.0 0.0 0.0 0.0 0.0 0.0 0.0 0.1 0.0 Crown and Root Prune 0.1 9.8 0.0 0.0 0.0 0.0 0.0 0.0 9.9 0.1 Remove/Replace Con. 0.0 0.8 0.0 0.0 0.0 0.0 0.0 0.0 0.8 0.0 Concrete Disposal 1.2 23.5 0.0 0.0 0.0 0.0 0.0 0.0 24.7 0.3 Biomass Disposal 0.0 0.1 0.0 0.0 0.0 0.0 0.0 0.0 0.142 0.0 Subtotal 1.5 34.2 0.0 0.0 0.0 0.0 0.0 0.0 35.7 0.4 1,100.6 2,813.8 11.8 2,401.8 1,129.0 1.8 86.7 291.4 7,836.8 85.4 Grand Total


