samples deformation
advertisement
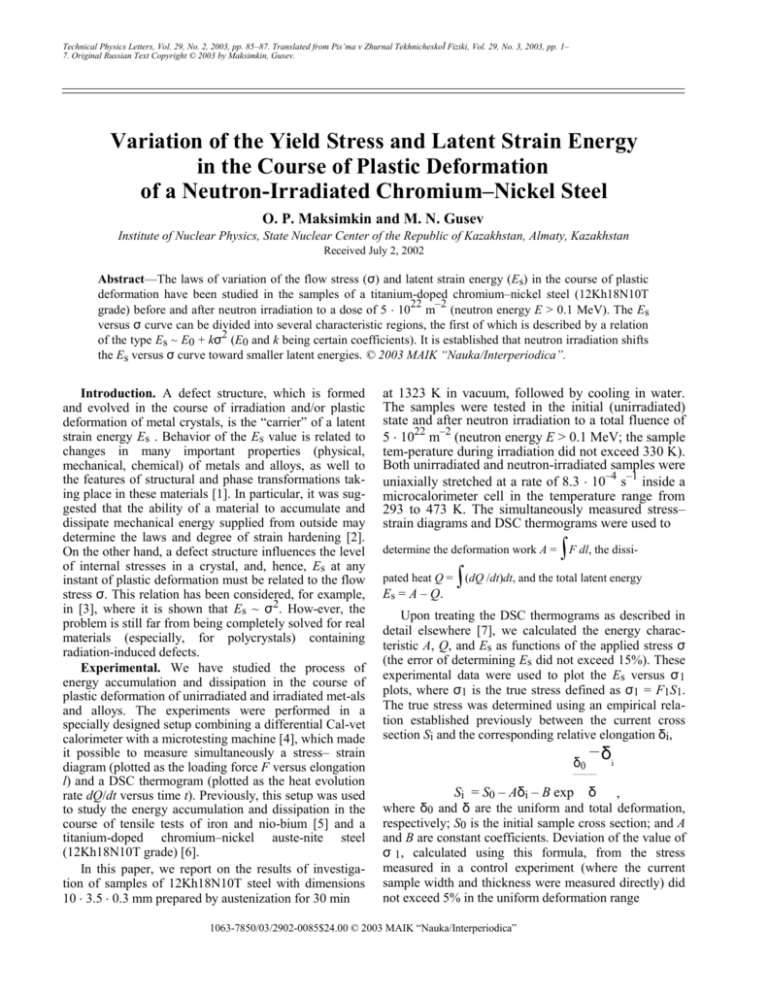
Technical Physics Letters, Vol. 29, No. 2, 2003, pp. 85–87. Translated from Pis’ma v Zhurnal TekhnicheskoÏ Fiziki, Vol. 29, No. 3, 2003, pp. 1– 7. Original Russian Text Copyright © 2003 by Maksimkin, Gusev. Variation of the Yield Stress and Latent Strain Energy in the Course of Plastic Deformation of a Neutron-Irradiated Chromium–Nickel Steel O. P. Maksimkin and M. N. Gusev Institute of Nuclear Physics, State Nuclear Center of the Republic of Kazakhstan, Almaty, Kazakhstan Received July 2, 2002 Abstract—The laws of variation of the flow stress (σ) and latent strain energy (Es) in the course of plastic deformation have been studied in the samples of a titanium-doped chromium–nickel steel (12Kh18N10T 22 –2 grade) before and after neutron irradiation to a dose of 5 10 m (neutron energy E > 0.1 MeV). The Es versus σ curve can be divided into several characteristic regions, the first of which is described by a relation 2 of the type Es ~ E0 + kσ (E0 and k being certain coefficients). It is established that neutron irradiation shifts the Es versus σ curve toward smaller latent energies. © 2003 MAIK “Nauka/Interperiodica”. Introduction. A defect structure, which is formed and evolved in the course of irradiation and/or plastic deformation of metal crystals, is the “carrier” of a latent strain energy Es . Behavior of the Es value is related to changes in many important properties (physical, mechanical, chemical) of metals and alloys, as well to the features of structural and phase transformations taking place in these materials [1]. In particular, it was suggested that the ability of a material to accumulate and dissipate mechanical energy supplied from outside may determine the laws and degree of strain hardening [2]. On the other hand, a defect structure influences the level of internal stresses in a crystal, and, hence, Es at any instant of plastic deformation must be related to the flow stress σ. This relation has been considered, for example, in [3], where it is shown that Es ~ σ2. How-ever, the problem is still far from being completely solved for real materials (especially, for polycrystals) containing radiation-induced defects. Experimental. We have studied the process of energy accumulation and dissipation in the course of plastic deformation of unirradiated and irradiated met-als and alloys. The experiments were performed in a specially designed setup combining a differential Cal-vet calorimeter with a microtesting machine [4], which made it possible to measure simultaneously a stress– strain diagram (plotted as the loading force F versus elongation l) and a DSC thermogram (plotted as the heat evolution rate dQ/dt versus time t). Previously, this setup was used to study the energy accumulation and dissipation in the course of tensile tests of iron and nio-bium [5] and a titanium-doped chromium–nickel auste-nite steel (12Kh18N10T grade) [6]. In this paper, we report on the results of investigation of samples of 12Kh18N10T steel with dimensions 10 3.5 0.3 mm prepared by austenization for 30 min at 1323 K in vacuum, followed by cooling in water. The samples were tested in the initial (unirradiated) state and after neutron irradiation to a total fluence of 5 1022 m–2 (neutron energy E > 0.1 MeV; the sample tem-perature during irradiation did not exceed 330 K). Both unirradiated and neutron-irradiated samples were uniaxially stretched at a rate of 8.3 10–4 s–1 inside a microcalorimeter cell in the temperature range from 293 to 473 K. The simultaneously measured stress– strain diagrams and DSC thermograms were used to determine the deformation work A = ∫F dl, the dissipated heat Q = ∫(dQ /dt)dt, and the total latent energy Es = A – Q. Upon treating the DSC thermograms as described in detail elsewhere [7], we calculated the energy characteristic A, Q, and Es as functions of the applied stress σ (the error of determining Es did not exceed 15%). These experimental data were used to plot the Es versus σ 1 plots, where σ1 is the true stress defined as σ1 = F1S1. The true stress was determined using an empirical relation established previously between the current cross section Si and the corresponding relative elongation δi, δ0 –δ i -------------- Si = S0 – Aδi – B exp δ , where δ0 and δ are the uniform and total deformation, respectively; S0 is the initial sample cross section; and A and B are constant coefficients. Deviation of the value of σ 1, calculated using this formula, from the stress measured in a control experiment (where the current sample width and thickness were measured directly) did not exceed 5% in the uniform deformation range 1063-7850/03/2902-0085$24.00 © 2003 MAIK “Nauka/Interperiodica” 86 MAKSIMKIN, GUSEV (restored as described in [7]), the experimental F versus l curve, and the stress–strain diagram (σ versus δ) calculated with allowance for a change in the sample cross section. The values of strength and plasticity parameters, as well as the energy characteristics of strain determined using the experimental results for 12Kh18N10T steel, are presented in the table. As can be seen from these data, the neutron-irradiated steel samples accumulate a significantly lower energy and dissipate a greater energy than do the initial (unirradiated) sam-ples. This behavior is in agreement with our previous results [6]. As can also be seen from Fig. 1, the true flow stress increases until the sample exhibits fracture, which is reflected by a high peak of heat evolution in the DSC thermogram. As the degree of sample deformation increases, the rate of latent energy accumulation decreases; after local strain development, almost no energy is accumulated in the material. Figure 2 shows the plots of specific latent energy Es versus flow stress σ. As can be seen, the curves corresponding to the initial and irradiated samples are similar, but the latter curve is shifted toward lower Es values (downward the energy axis). An analysis of the Es = f (σ ) function showed that the uniform deformation range can be divided into several characteristic regions, the first of which (corresponding to small deformations and stresses) is described by a relation of the type dQ/dt, mW (a) 6 4 2 1 2 0 500 1000 1500 t, s F σ, MPa (b) 1000 3 800 2 600 400 1 200 0 20 40 60 l, δ, % Es = E0 + kσ2 , Fig. 1. Typical experimental and recalculated curves for unirradiated 12Kh18N10T stainless steel samples tensile tested at 293 K: (a) primary (1) and restored (2) DSC thermograms; (b) stress–strain diagrams plotted as (1) load F versus total elongation l, (2) effective stress σ versus resid-ual strain δ, and (3) true stress σ1 versus residual strain δ. (1) where E0 and k are coefficients which can be assigned a certain physical meaning. It is most probable that the absolute value of E0 characterizes the internal energy of a polycrystal, which is related to a structural state of the initial (undeformed) material, the development of grain boundaries, and the morphology and concentration of defects in the crystal lattice. The numerical value of E0 can be determined using the experimental curve of Es = f ( σ ), through extrapolation of the approximating parabola to intersection with the ordinate axis (σ = 0). It was found (see table) that unirradiated steel tensile tested at various temperatures in the interval from 293 to 473 K is char- (below, we omit the subscript and denote the true stress by σ). Results and discussion. Figure 1 shows a primary DSC thermogram (distorted because of a delay in the calorimeter response) measured in the course of the cal-orimetric run, the corresponding true thermogram Mechanical and energy characteristics of 12Kh18N10T steel before and after neutron irradiation (total fluence, 5 1022 m–2) Sample state and test σ , MPa σ , MPa temperature, K 0.2 u Initial 298 Irradiated Initial 423 Irradiated Initial Irradiated 473 δ ,% δ, % A, MJ/m 3 3 Q, MJ/m 0 E 3 , MJ/m k 10 –4 s E0, MJ/m 3 18 660 65 70 410 310 100 1.5 6 440 720 53 61 405 332 73 1.4 25 140 440 34 37 140 90 50 1.8 5 330 530 37 42 200 152 48 1.8 18 140 470 33 36 142 96 46 2.0 5 320 500 29 34 162 119 43 2.0 16 Note: the values of k refer to region 1 in Fig. 2. TECHNICAL PHYSICS LETTERS Vol. 29 No. 2 2003 VARIATION OF THE YIELD STRESS AND LATENT STRAIN ENERGY Es, MJ/m 3 L inate in the strained material [1]. As can be seen from Fig. 2, the Es versus σ curve for the irradiated steel is shifted by ~20 MJ/m3 toward lower energies, which is probably related to an additional latent energy related to the radiation-induced defects. Another noteworthy experimental fact is the presence of certain features in the temperature variation of parameter k in the first region separated on the Es = f ( σ) curve (see table). The higher the temperature of test-ing, the greater the k value. The temperature sensitivity of k can be related to an increase in the stacking fault energy with increasing temperature known in stainless steels [8, 9]. Conclusion. We have experimentally studied the relationship between the latent strain energy Es and the flow stress σ of 12Kh18N10T stainless steel samples continuously strained inside a calorimetric cell after austenization and neutron irradiation to a total fluence of 5 1022 m–2. It is established that the Es(σ) curve can be divided into several characteristic regions, the first of which is described by a relation of the type Es ~ kσ2 . a 4 80 L b 3 60 4 2 3 40 1 20 2 1 0 0 200 400 600 800 1000 σ, MPa REFERENCES Fig. 2. Plots of the latent strain energy Es versus flow stress σ for (a) initial and (b) neutron-irradiated 12Kh18N10T steel tensile tested at 293 K. Dashed curve represents the approximating parabola for region 1; region L corresponds to the state of local strain development. acterized by very close E0 values. This fact may be evi-dence of the structural sensitivity of the E0 value. At the same time, the E0 values of irradiated samples decrease with increasing temperature. This is probably related to partial annealing of the radiation defects in the course of heating the sample up to the temperature of tensile testing. Note that a quadratic dependence of the stored energy on the flow stress in the early stage of deforma-tion was also observed in our experiments with pure copper (both unirradiated and neutronirradiated to a dose of 2 1024 m–2) [10]. The curves of Es = f (σ) for both initial and neutronirradiated samples of 12Kh18N10T steel (Fig. 2) reveal four characteristic regions in the range of stresses below ultimate strength. This does not contradict the existing notions about plastic flow stages, whereby var-ious dislocation structures sequentially form and dom- TECHNICAL PHYSICS LETTERS Vol. 29 No. 2 87 2003 1. M. A. Bol’shanina and V. E. Panin, Latent Strain Energy, in Investigations in Solid State Physics (Akademizdat, Moscow, 1957). 2. V. V. Rybin, Large Plastic Deformations and Fracture of Metals (Metallurgiya, Moscow, 1986). 3. J. Friedel, Dislocations (Oxford, 1964; Mir, Moscow, 1967). 4. O. P. Maksimkin, Preprint 94-02 (Physicotechnical Insti-tute, Natl. Acad. Sci., Kazakhstan, Almaty, 1994). 5. O. P. Maksimkin and M. N. Gusev, Pis’ma Zh. Tekh. Fiz. 27 (24), 85 (2001) [Tech. Phys. Lett. 27, 1065 (2001)]. 6. Sh. Sh. Ibragimov, O. P. Maksimkin, and A. V. Bolotov, At. Energ. 66 (6), 430 (1989). 7. I. V. Astaf’ev and O. P. Maksimkin, Zavod. Lab., No. 1, 44 (1994). 8. Yu. N. Petrov, Defects and Diffusionless Transformations in Steel (Naukova Dumka, Kiev, 1972), p. 101. 9. O. P. Maksimkin and M. N. Gusev, in Effects of Radiation on Materials: Proceedings of the 20th International Symposium (ASTM Spec. Tech. Publ. 1405) (ASTM, 2001), pp. 813–824. Translated by P. Pozdeev

