7.b. IASC Standard Indicators by Cluster
advertisement
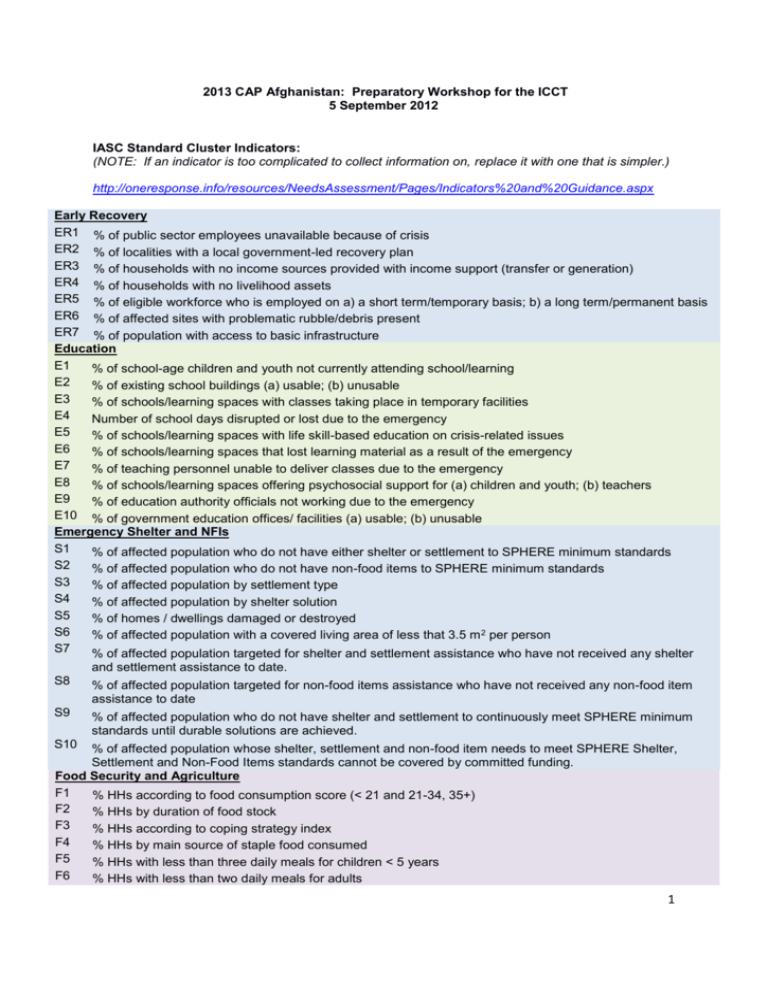
2013 CAP Afghanistan: Preparatory Workshop for the ICCT 5 September 2012 IASC Standard Cluster Indicators: (NOTE: If an indicator is too complicated to collect information on, replace it with one that is simpler.) http://oneresponse.info/resources/NeedsAssessment/Pages/Indicators%20and%20Guidance.aspx Early Recovery ER1 % of public sector employees unavailable because of crisis ER2 % of localities with a local government-led recovery plan ER3 % of households with no income sources provided with income support (transfer or generation) ER4 % of households with no livelihood assets ER5 % of eligible workforce who is employed on a) a short term/temporary basis; b) a long term/permanent basis ER6 % of affected sites with problematic rubble/debris present ER7 % of population with access to basic infrastructure Education E1 % of school-age children and youth not currently attending school/learning E2 % of existing school buildings (a) usable; (b) unusable E3 % of schools/learning spaces with classes taking place in temporary facilities E4 Number of school days disrupted or lost due to the emergency E5 % of schools/learning spaces with life skill-based education on crisis-related issues E6 % of schools/learning spaces that lost learning material as a result of the emergency E7 % of teaching personnel unable to deliver classes due to the emergency E8 % of schools/learning spaces offering psychosocial support for (a) children and youth; (b) teachers E9 % of education authority officials not working due to the emergency E10 % of government education offices/ facilities (a) usable; (b) unusable Emergency Shelter and NFIs S1 % of affected population who do not have either shelter or settlement to SPHERE minimum standards S2 % of affected population who do not have non-food items to SPHERE minimum standards S3 % of affected population by settlement type S4 % of affected population by shelter solution S5 % of homes / dwellings damaged or destroyed S6 % of affected population with a covered living area of less that 3.5 m 2 per person S7 % of affected population targeted for shelter and settlement assistance who have not received any shelter and settlement assistance to date. S8 % of affected population targeted for non-food items assistance who have not received any non-food item assistance to date S9 % of affected population who do not have shelter and settlement to continuously meet SPHERE minimum standards until durable solutions are achieved. S10 % of affected population whose shelter, settlement and non-food item needs to meet SPHERE Shelter, Settlement and Non-Food Items standards cannot be covered by committed funding. Food Security and Agriculture F1 % HHs according to food consumption score (< 21 and 21-34, 35+) F2 % HHs by duration of food stock F3 % HHs according to coping strategy index F4 % HHs by main source of staple food consumed F5 % HHs with less than three daily meals for children < 5 years F6 % HHs with less than two daily meals for adults 1 F7 % HHs without physical access to any market F8 % markets by level of decreases in availability of main staple food F9 % markets with price of main staple foods increased by at least 20% F10 % HHs by main income source F11 % HHs by main type of cash expenditure (e.g. food, health, transportation, housing) F12 Average daily casual labour wage F13 % HHs receiving food assistance, by type of assistance F14 % of HHs receiving cash / voucher Health H1 Average population per health facility H2 Number of HF with Comprehensive Emergency Obstetric Care / 500,000 population H3 % of HF providing selected relevant services H4 Number of health workers (MD + nurse + midwife) per 10,000 population H5 Number of CHW per 10,000 population H6 Number of outpatients consultations H7 Coverage of measles vaccination ( 6 months - 15 years) H8 % of expected deliveries by Cesarean section H9 Number of cases or incidence rates for selected diseases relevant to the local context H10 Number of reported cases of sexual violence Nutrition N1 % children 6 - 59 months acutely malnourished a) pre-crisis, b) currently N2 Number of children 6 - 59 months moderately acutely malnourished a) currently b) pre-crisis N3 Number children 6 - 59 months severely acutely malnourished a) currently, b)pre-crisis N4 % acutely severely acutely malnourished children 6-59 months enrolled in admitted to therapeutic feeding N5 N6 N7 N8 programmes % of moderately acutely malnourished 6-59 month enrolled supplementary feeding programmes % of infants aged 0-5 months who are: a) fed exclusively with breast milk, b) Formula fed, c) Partially breastfed % of infants 6-8 months of age who receive solid, semi-solid and soft food Proportion of children 6 - 23 months of age who receive food from 4 or more food groups currently and precrisis N9 Proportion of children (breastfed and non-breastfed) 6 - 23 months of age who received solid, semi-solid and soft foods for the minimum number of times or more number of daily feeding episodes in children. N10 Proportion of mother with children 0-23 months receiving IYCF counseling N11 Proportion of children 6 - 59 months having received vitamin A in previous 6 months Protection P1 Number of civilians injured in violence P2 % of surveyed sites where there are reported attacks directed at the civilian population P3 Number of civilians reported or estimated killed by violence P4 % of surveyed sites where civilians are being deliberately killed by armed actors P5 Number of community assets (e.g. bridge, school, hospital, place of worship) deliberately attacked P6 % of surveyed sites where civilians are being coerced into assisting combatants or arms bearers P7 % of affected population living in surveyed sites with indications that mines and explosive remnants of war, or unexploded munitions / devices are currently present P8 Number of reports of disappearances / abductions P9 % of surveyed sites reporting that disappearances / abductions are taking place P10 % of surveyed sites where the civilian community is threatened by armed actors P11 Number of reported cases of torture or cruel, inhuman or degrading treatment or punishment 2 P12 P13 P14 P15 P16 P17 P18 P19 P20 P21 P22 P23 P24 P25 P26 P27 P28 P29 P30 P31 P32 P33 P34 P35 % of surveyed sites where there are reports of torture or cruel, inhuman or degrading treatment or punishment % of health facilities equipped to respond to GBV survivors (e.g. PEP kits) % of affected population with access to security services. % of surveyed sites with communal facilities with separate toilet and bathing facilities for males and females Number of reports of sexual violence per 10,000 people Is there a data system in place to systematically collect IDP population data? (Y/N) % of reporting surveyed sites where arbitrary restrictions on freedom of movement exist Number of separated children / unaccompanied children / orphaned children Number of children reported missing % of unaccompanied and separated children for whom family tracing has been successful Number of children in institutional care Number of reports of people arbitrarily detained Number of reported cases of trafficking for exploitation (labour or sex) % of reporting communities indicating recruitment of children Number of children newly reported to be associated with armed forces and groups Number of children newly released from armed forces and groups Number of children in worst forms of child labour % of surveyed sites with active denial or obstruction of adequate food % of children with safe access to community spaces for socializing, play, learning, etc. % of surveyed sites with active denial or obstruction of adequate justice mechanisms % of surveyed sites in which international and/or national humanitarian organizations' access to affected populations has been limited by duty bearers or armed actors Months since population data was updated % of the affected population lacking personal identity documents. % of surveyed sites where there is a functioning dispute resolution mechanism (judicial or customary/informal) to address housing, land and property grievances P36 % of affected population who may be at risk of eviction or unauthorized occupation / confiscation of their property Camp Management ( could be adopted for monitoring internal displacement by the IDP Taskforce) C1 % of IDP population living in settlements/ camps/host communities that have been registered at the household level C2 % of IDP population living in settlements/camps/host communities that have been registered at the individual level C3 % of displaced people living in settlements/camps/host communities or collective centres managed by DoRR, NGOs/ IDP taskforce C4 % of IDP settlements/camps that have a dispute resolution mechanism C5 % of IDP settlements/camps/ IDP settled within host communities with at least one NFI distribution carried out in the last three months C6 % of IDP settlements/camps in which people are able to move freely inside and outside the settlement/camp C7 % of IDP settlements/camps where household registration services are available for residents C8 % of IDP settlements /camps where individual registration services are available for residents C9 % of IDP settlements/ camps where programmes for disabled persons are offered to residents C10 % of IDP settlements /camps where programmes for single heads of household are offered to residents C11 % of settlements/ camps where programmes for older persons are offered to residents C12 % of settlements/ camps where programmes for children are offered to residents Water, Sanitation and Hygiene W1 Average population per toilet / latrine W2 Average population per toilet / latrine with functioning hand washing facility W3 Proportion of households possessing soap W4 % of population with access to 15 litres of water per person per day 3 W5 W6 W7 W8 % of population with access to bathing facilities (m/f separated, if communal) % of population with access to laundry facilities % of sites with solid waste in the open % of sites with stagnant water 4

