SCHOOL/GRADE LEVEL GROWTH AND ACHIEVEMENT REPORT
advertisement
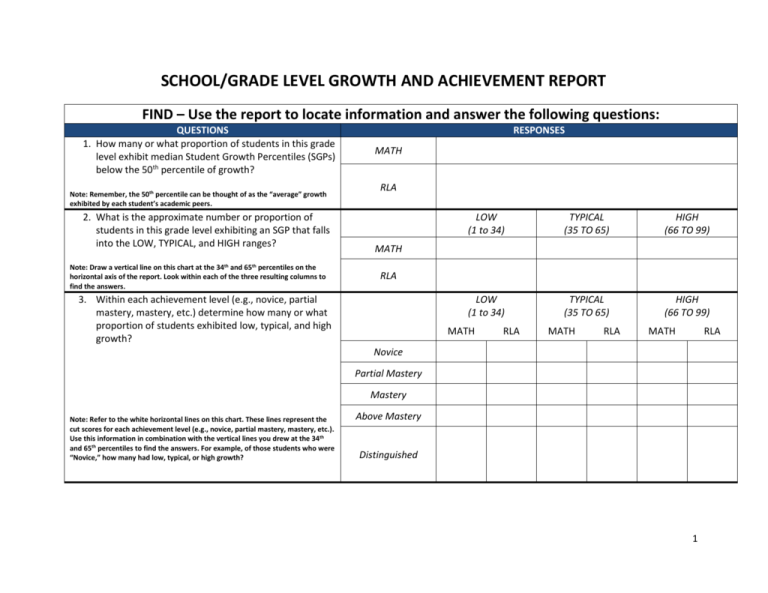
SCHOOL/GRADE LEVEL GROWTH AND ACHIEVEMENT REPORT FIND – Use the report to locate information and answer the following questions: QUESTIONS 1. How many or what proportion of students in this grade level exhibit median Student Growth Percentiles (SGPs) below the 50th percentile of growth? Note: Remember, the 50th percentile can be thought of as the “average” growth exhibited by each student’s academic peers. 2. What is the approximate number or proportion of students in this grade level exhibiting an SGP that falls into the LOW, TYPICAL, and HIGH ranges? Note: Draw a vertical line on this chart at the 34th and 65th percentiles on the horizontal axis of the report. Look within each of the three resulting columns to find the answers. RESPONSES MATH RLA LOW (1 to 34) TYPICAL (35 TO 65) HIGH (66 TO 99) LOW (1 to 34) TYPICAL (35 TO 65) HIGH (66 TO 99) MATH RLA 3. Within each achievement level (e.g., novice, partial mastery, mastery, etc.) determine how many or what proportion of students exhibited low, typical, and high growth? MATH RLA MATH RLA MATH RLA Novice Partial Mastery Mastery Note: Refer to the white horizontal lines on this chart. These lines represent the cut scores for each achievement level (e.g., novice, partial mastery, mastery, etc.). Use this information in combination with the vertical lines you drew at the 34th and 65th percentiles to find the answers. For example, of those students who were “Novice,” how many had low, typical, or high growth? Above Mastery Distinguished 1 FIND – Use the report to locate information and answer the following questions: 4. Using the mouseover function in the PDF Chart, identify the following information for the highest and lowest growth students. Student Growth Percentile Student TARGET Growth Percentile Student Achievement Level Student Scale Score Highest Growth Note: Adobe’s mouseover function is not supported on iPad because iPad does not have a mouse. Lowest Growth ANALYZE AND INTERPRET: Use what you have discovered to answer the following questions: QUESTIONS 1. In which grade levels are there multiple students in the “novice” or “partial mastery” achievement levels are exhibiting high growth? RESPONSES MATH RLA 2. For any of the students identified in #1 above, does the target student growth percentile appear to indicate he/she is on track to meet or exceed proficiency expectations if he/she sustains this level of growth? If so, what level of growth does he/she require? Note: Use the mouseover function to view the student’s current and target SGPs. If the current SGP is equal to or exceeds the target, then the model projects the student will meet or exceed proficiency expectations within three years or by 11th grade, whichever is sooner if this growth is sustained. The “target” SGP indicates the level of growth necessary. 2 ANALYZE AND INTERPRET: Use what you have discovered to answer the following questions: 3. In which grade levels are there multiple students in the “mastery,” “above mastery,” or “distinguished” achievement levels are exhibiting low growth? MATH RLA MATH RLA 4. For any of the students identified in #3 above, does the target student growth percentile appear to indicate he/she is on track to maintain proficiency expectations if he/she sustains this level of growth? Note: Use the mouseover function to view the student’s current and target SGPs. If the current SGP is less than the target, then the model projects the student will not maintain proficiency expectations within three years or by 11th grade, whichever is sooner if this growth is sustained. 5. What other groups of students are you interested in examining further based upon the growth and achievement data? 3 PLAN NEXT STEPS: Now that you know something about the growth that has occurred in your grade/school this past year, where can you go to get more information? RESOURCES/DESCRIPTION Growth Model School Level Summary Report: This report, available via the WVDE NCLB private site, presents summary level growth information for a selected school. The report presents the number and percentage of students within the school who achieved low, typical, and high growth as well as the median growth percentile for the school and the percentage of students who achieved proficiency. These data are provided for the all subgroup and disaggregated by grade level. County and state data are also presented for comparison purposes. The report contains a number of clickable links: (1) school level keeping up/catching up status report, (2) growth model school level summary data disaggregated by subgroups, (3) a graphical representation of the growth model school level summary report, and (4) links to the available “Grade Level Growth and Achievement Reports.” These data are provided for mathematics and reading/language arts. QUESTIONS Where can I learn more about the growth of individual students in your school and how that growth relates to the school as a whole? RESPONSE Growth Model School Level Keeping Up/Catching Up Status Report: This report, available via the WVDE NCLB private site, presents additional summary level growth information for the selected school. Specifically, the report shows the number and percentage of students projected to “catch up” or “keep up” with proficiency expectations based upon their observed growth and the model’s estimate regarding the level of growth that is necessary for the student to reach or maintain proficiency within a defined period of time. This information is provided for all students and disaggregated by grade. A clickable link provides keep up/catch up information for students in the school disaggregated by subgroup. Individual Student Growth and Achievement Report: This report shows a student’s Growth Percentiles and Growth Levels over a four-year period (depending on grade level). The report can be used to review past growth to assess student progress toward WESTEST 2 achievement goals, develop remediation or enrichment plans based on rate of growth needed to reach higher WESTEST 2 achievement levels, and identify the rate of progress needed to reach or maintain proficient status on the WESTEST 2 next year. Electronic Confidential Summary Report (eCSR): This report, accessible via the WVDE NCLB private site, provides summary academic achievement data for a selected grade level within a selected school. The report provides the number of Where can I learn about grade level mastery of specific content 4 students tested and the distribution of students disaggregated by academic achievement level. The report also provides the mean scale score for the grade and aggregated numbers and percentages of students who were assessed “at or above mastery” or “below mastery” expectations. These data are presented for all students as well as disaggregated by subgroup. County and state data are provided for comparison. Further, the report provides school level summary information about all students’ mastery of grade level content standards. standards in this school by grade WESTEST 2 Content Standards and Objectives Analysis Report (WESTEST 2/CSO Analysis): This report, accessible via the WVDE NCLB private site, provides summary academic achievement data for a selected grade level within the selected school. Users can examine student performance on the WESTEST 2 by content standard. The number of items tested for each content standard, the average number of correct responses, and the percentage correct are displayed. Data are accessible for each content area, grade, and subgroup and school, district and state results are provided for comparison. 5
