Supporting Information Test cutoff values In eTable 1, we list the
advertisement
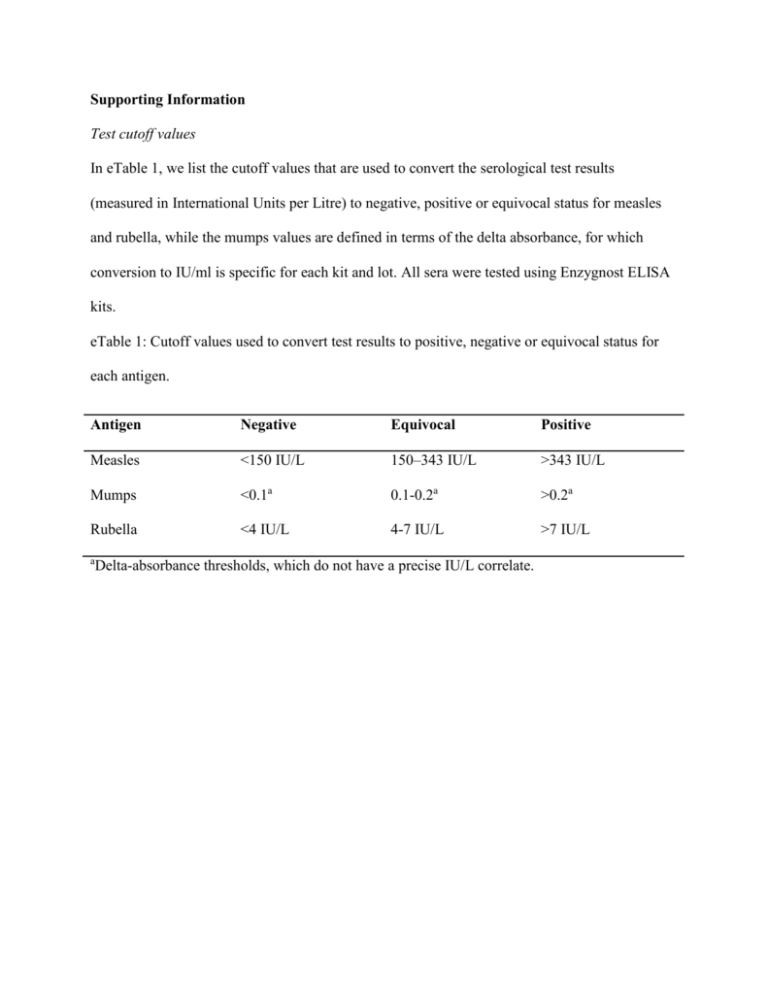
Supporting Information Test cutoff values In eTable 1, we list the cutoff values that are used to convert the serological test results (measured in International Units per Litre) to negative, positive or equivocal status for measles and rubella, while the mumps values are defined in terms of the delta absorbance, for which conversion to IU/ml is specific for each kit and lot. All sera were tested using Enzygnost ELISA kits. eTable 1: Cutoff values used to convert test results to positive, negative or equivocal status for each antigen. Antigen Negative Equivocal Positive Measles <150 IU/L 150–343 IU/L >343 IU/L Mumps <0.1a 0.1-0.2a >0.2a Rubella <4 IU/L 4-7 IU/L >7 IU/L a Delta-absorbance thresholds, which do not have a precise IU/L correlate. Matrix form of wane-boost tensor products The tensor-product notation used in the main-text simplifies the notation required to specify the cohort model but we appreciate that it is not familiar to all audiences that might be interested in our method. As such, we also provide here the 8x8 matrix elements for the wane-boost matrices: W = W1 Ä W2 Ä W3 = æ (1 - w1 )(1 - w2 )(1 - w3 ) 0 0 0 ç (1 - w1 )(1 - w2 ) 0 0 ç (1 - w1 )(1 - w2 )w3 ç (1 - w1 )w2 (1 - w3 ) 0 (1 - w1 )(1 - w3 ) 0 ç (1 - w1 )w2 w3 (1 - w1 )w2 (1 - w1 )w3 1 - w1 ç ç w1 (1 - w2 )(1 - w3 ) 0 0 0 ç w1 (1 - w2 )w 3 w1 (1 - w2 ) 0 0 ç ç w1w2 (1 - w3 ) 0 w1 (1 - w3 ) 0 ç çè w1w2 w3 w1w2 w1w3 w1 0 0 0 0 0 0 0 0 0 0 0 0 0 0 0 0 (1 - w2 )(1 - w3 ) 0 0 0 (1 - w2 )w3 1 - w2 0 0 w2 (1 - w3 ) 0 1 - w3 0 w2 w 3 w2 w3 1 ö ÷ ÷ ÷ ÷ ÷ ÷ ÷ ÷ ÷ ÷ ÷ø E(t ) = E j 1 (t ) Ä E j 2 (t ) Ä E j 3 (t ) = æ ç ç ç ç ç ç ç ç ç ç çè 1 e3 e2 e2 e3 e1 0 1 - e3 0 e2 (1 - e3 ) 0 0 0 1 - e2 (1 - e2 )e3 0 0 0 0 (1 - e2 )(1 - e3 ) 0 0 0 0 0 1 - e1 0 0 0 0 0 0 0 0 0 0 0 0 0 0 0 ö ÷ e1 (1 - e3 ) 0 e1e2 (1 - e3 ) ÷ ÷ 0 e1 (1 - e2 ) e1 (1 - e2 )e3 ÷ 0 0 e1 (1 - e2 )(1 - e3 ) ÷ , ÷ (1 - e1 )e3 (1 - e1 )e2 (1 - e1 )e2 e3 ÷ (1 - e1 )(1 - e3 ) 0 (1 - e1 )e2 (1 - e3 ) ÷ ÷ 0 (1 - e1 )(1 - e2 ) (1 - e1 )(1 - e2 )e3 ÷ 0 0 (1 - e1 )(1 - e2 )(1 - e3 ) ÷ø e1e3 e1e2 e1e2 e3 where we suppress time labels from the E matrix elements due to space restrictions. The tensor product expression in equation 1 in the main text can be expressed in terms of a standard matrix product using these matrices: g j (t) = (W1 E j1 (t) ÄW2 E j 2 (t) ÄW3 E j3 (t)) j-1V j g 0 = (WE(t)) j-1V jg0 , g0 = [0,...0,1]T Fits without waning to 1998/9 data In the main text we present fits of the model without waning to just the 2007 data. Here we show equivalent fits with use of just complete case data, or augmented via direct-likelihood for the 1998 and 1999 data respectively. For these datasets, the estimates of coverage and seroconversion rates are generally more reasonable (eFigure 1 (1998) and eFigure 2 (1999)). One explanation for this is that the age range is more constrained, with waning of vaccine-derived immunity less likely to be manifest at this age point. In addition, natural boosting to measles, mumps and rubella during the 1990s was significant with measles and rubella incidence much higher during this period than following the 1998 mass vaccination campaign. eFigure 1: Vaccine coverage (a) and seroconversion probability (b) estimates for multisera data collected in Australia in 1998, using complete cases only (CD, green squares) and a directlikelihood approach (DL, red triangles). eFigure 2: Vaccine coverage (a) and seroconversion probability (b) estimates for multisera data collected in Australia in 1999, using complete cases only (CD, green squares) and a directlikelihood approach (DL, red triangles). Exposure probabilities for cohort model fits In eFigure 3, we show the (geometric) mean annual exposure probabilities that correspond to the cohort model fits to Australian data in Figure 5 of the main text. Most of estimates are very high in comparison to Australian disease notification data for these antigens over the period of analysis, but we note the wide confidence intervals that include 0 for all but two of the estimates (measles, prior to 1998 for the 1989 and 1993 birth cohorts). eFigure 3: Estimated exposure probabilities from fits to combined data from three serosurveys on individual birth cohorts from 1989-1993, with measles, mumps and rubella estimates shown in panel (a)-(c) respectively. Estimates for the period prior to measles control campaign (1998) are shown in blue, while estimates from 1999-2007 are shown in red. Corresponding shaded regions represent 95% CIs, generated through fitting to 1000 resampled datasets. Equivocal results In the main analysis, we treat equivocal results as missing data but here we consider the effect of two common assumptions: that equivocal results should be interpreted as positive or negative values respectively. In eFigure 4 we show the results for three-time point estimation for the positive assumption while in eFigure 5 we show the results for the negative assumption. eFigure 4: Fits to combined data from three serosurveys on individual birth cohorts from 19891993 with assumption that equivocal sera are positive. In (a), vaccine coverage estimates for the first dose (blue), the 1998 catchup campaign (red) and total coverage with at least 1 dose (green) are shown; in (b) estimates of the proportion seroconverting for each antigen in dose 1 (blue) and the catchup campaign (red) are shown; in (c) the estimated annual proportion of seroconverted individuals who wane is shown for the three antigens. The 95% CIs were generated through fitting to 1000 resampled datasets. eFigure 5: Fits to combined data from three serosurveys on individual birth cohorts from 19891993 with assumption that equivocal sera are negative. In (a), vaccine coverage estimates for the first dose (blue), the 1998 catchup campaign (red) and total coverage with at least 1 dose (green) are shown; in (b) estimates of the proportion seroconverting for each antigen in dose 1 (blue) and the catchup campaign (red) are shown; in (c) the estimated annual proportion of seroconverted individuals who wane is shown for the three antigens. The 95% CIs were generated through fitting to 1000 resampled datasets. Additional simulation analyses In this section we present additional simulation studies for alternate parameter combinations that represent settings with lower coverage and higher exposure. In eFigure 6, the annual probability of exposure for each antigen is set at 10%, while vaccine coverage is set at 70%, representing a setting with moderate coverage not sufficient to attain elimination. In this instance, the confidence intervals around parameter estimates (in particular coverage) are much wider for a given sample size. The degree of variance also increases with age, with coverage likely to be underestimated at older ages with small sample sizes. eFigure 6: Fits to simulated data generated via the cohort model, with sample sizes restricted to 2007 complete cases (blue circles) or 1000 samples per age group (green triangles). Coverage estimates are shown in (a), seroconversion estimates in (b) and rates of waning in (c). In each case, simulation-based confidence intervals were generated using simulated data, with point estimates representing the corresponding medians. The true coverage, seroconversion and waning parameters are shown using red squares. Coverage is set at 70% with annual exposure probability of 10% for each of the antigens (2-time point cohort model). Fits of the mis-specified model (without waning) in this situation tend to under-estimate the vaccine coverage to a greater extent than in low incidence settings but the estimated seroconversion properties are closer to the true parameters (eFigure 7). eFigure 7: Fits to simulated data generated via the cohort model using a mis-specified model without waning, with sample sizes restricted to 2007 complete cases (blue circles) or 1000 samples per age group (green triangles). Coverage estimates are shown in (a), seroconversion estimates in (b) and rates of waning in (c). In each case, simulation-based confidence intervals were generated using simulated data, with point estimates representing the corresponding medians. The true coverage, seroconversion and waning parameters are shown using red squares. Coverage is set at 70% coverage, and a 10% exposure probability per year for each antigen is used. In eFigure 8, we consider a situation in transition from moderate to high coverage, with coverage increasing from 70-90% over a period of 9 years, while annual exposure probabilities fall from 5% to 1% for each antigen over the same period and then remain at this level. The precision of coverage estimates is improved in this situation, largely as a result of the lower exposure probabilities, with vaccination less likely to mis-identified as exposure. eFigure 8: Fits to simulated data generated via the cohort model, with sample sizes restricted to 2007 complete cases (blue circles) or 1000 samples per age group (green triangles). Coverage estimates are shown in (a), seroconversion estimates in (b) and rates of waning in (c). In each case, simulation-based confidence intervals were generated using simulated data, with point estimates representing the corresponding medians. The true coverage, seroconversion and waning parameters are shown using red squares. Coverage is assumed to increase from 70%90% over 9 years while the annual exposure probability drops from 5% to 1% over the same period (2-time point cohort model). In eFigure 9 we show the fits of the mis-specified model to the same simulated data. The results are similar to those in the main text, with substantial underestimation of coverage for older cohorts and seroconversion probabilities (particular for mumps). eFigure 9: Fits to simulated data generated via the cohort model using a mis-specified model without waning, with sample sizes restricted to 2007 complete cases (blue circles) or 1000 samples per age group (green triangles). Coverage estimates are shown in (a), seroconversion estimates in (b) and rates of waning in (c). In each case, simulation-based confidence intervals were generated using simulated data, with point estimates representing the corresponding medians. The true coverage, seroconversion and waning parameters are shown using red squares. Coverage is assumed to increases from 70%-90% while annual exposure probabilities drop from 5% to 1% over 9 years for each antigen, with these parameters then remaining constant over the remaining 9 years. Estimation with complete cases only In eFigure 10, we show fits to the three time point Australian data using only complete cases (excluding those with missing or equivocal test results). The main effect of this exclusion is that it increases the width of confidence intervals for the vaccine coverage estimates. This is not unexpected, as the majority of missing data occurs in the first two serosurveys (1998 and 1999), which largely determine the vaccine coverage estimates. eFigure 10: Fits to combined data from three serosurveys on individual birth cohorts from 19891993 using complete case data only. In (a), vaccine coverage estimates for the first dose (blue), the 1998 catchup campaign (red) and total coverage with at least 1 dose (green) are shown; in (b) estimates of the proportion seroconverting for each antigen in dose 1 (blue) and the catchup campaign (red) are shown; in (c) the estimated annual proportion of seroconverted individuals who wane is shown for the three antigens. In each case, 95% CIs are generated through bootstraps (1000 resampled datasets).

