Supplemental Table S2. Association of non
advertisement
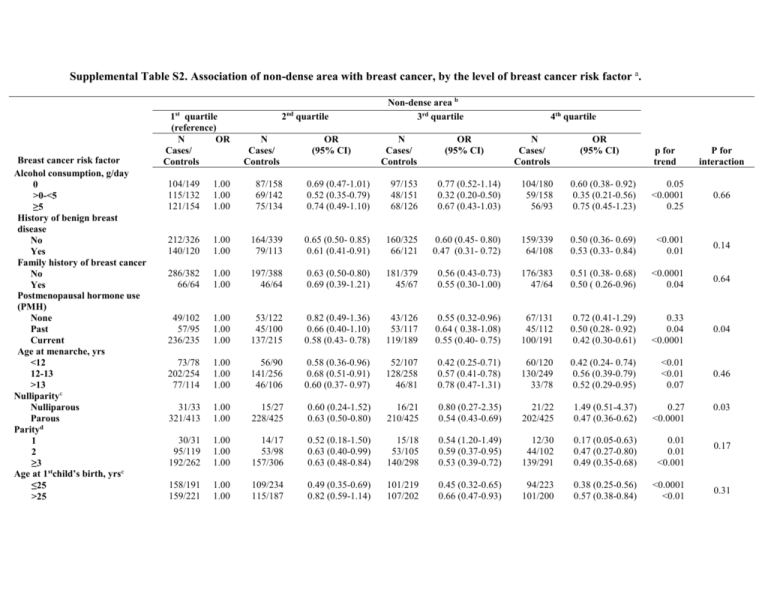
Supplemental Table S2. Association of non-dense area with breast cancer, by the level of breast cancer risk factor a. st Breast cancer risk factor Alcohol consumption, g/day 0 >0-<5 ≥5 History of benign breast disease No Yes Family history of breast cancer No Yes Postmenopausal hormone use (PMH) None Past Current Age at menarche, yrs <12 12-13 >13 Nulliparityc Nulliparous Parous Parityd 1 2 ≥3 Age at 1stchild’s birth, yrse ≤25 >25 1 quartile (reference) N OR Cases/ Controls nd 2 quartile N Cases/ Controls OR (95% CI) Non-dense area b 3rd quartile N Cases/ Controls OR (95% CI) 4th quartile N Cases/ Controls OR (95% CI) p for trend P for interaction 104/149 115/132 121/154 1.00 1.00 1.00 87/158 69/142 75/134 0.69 (0.47-1.01) 0.52 (0.35-0.79) 0.74 (0.49-1.10) 97/153 48/151 68/126 0.77 (0.52-1.14) 0.32 (0.20-0.50) 0.67 (0.43-1.03) 104/180 59/158 56/93 0.60 (0.38- 0.92) 0.35 (0.21-0.56) 0.75 (0.45-1.23) 0.05 <0.0001 0.25 0.66 212/326 140/120 1.00 1.00 164/339 79/113 0.65 (0.50- 0.85) 0.61 (0.41-0.91) 160/325 66/121 0.60 (0.45- 0.80) 0.47 (0.31- 0.72) 159/339 64/108 0.50 (0.36- 0.69) 0.53 (0.33- 0.84) <0.001 0.01 0.14 286/382 66/64 1.00 1.00 197/388 46/64 0.63 (0.50-0.80) 0.69 (0.39-1.21) 181/379 45/67 0.56 (0.43-0.73) 0.55 (0.30-1.00) 176/383 47/64 0.51 (0.38- 0.68) 0.50 ( 0.26-0.96) <0.0001 0.04 0.64 49/102 57/95 236/235 1.00 1.00 1.00 53/122 45/100 137/215 0.82 (0.49-1.36) 0.66 (0.40-1.10) 0.58 (0.43- 0.78) 43/126 53/117 119/189 0.55 (0.32-0.96) 0.64 ( 0.38-1.08) 0.55 (0.40- 0.75) 67/131 45/112 100/191 0.72 (0.41-1.29) 0.50 (0.28- 0.92) 0.42 (0.30-0.61) 0.33 0.04 <0.0001 0.04 73/78 202/254 77/114 1.00 1.00 1.00 56/90 141/256 46/106 0.58 (0.36-0.96) 0.68 (0.51-0.91) 0.60 (0.37- 0.97) 52/107 128/258 46/81 0.42 (0.25-0.71) 0.57 (0.41-0.78) 0.78 (0.47-1.31) 60/120 130/249 33/78 0.42 (0.24- 0.74) 0.56 (0.39-0.79) 0.52 (0.29-0.95) <0.01 <0.01 0.07 0.46 31/33 321/413 1.00 1.00 15/27 228/425 0.60 (0.24-1.52) 0.63 (0.50-0.80) 16/21 210/425 0.80 (0.27-2.35) 0.54 (0.43-0.69) 21/22 202/425 1.49 (0.51-4.37) 0.47 (0.36-0.62) 0.27 <0.0001 30/31 95/119 192/262 1.00 1.00 1.00 14/17 53/98 157/306 0.52 (0.18-1.50) 0.63 (0.40-0.99) 0.63 (0.48-0.84) 15/18 53/105 140/298 0.54 (1.20-1.49) 0.59 (0.37-0.95) 0.53 (0.39-0.72) 12/30 44/102 139/291 0.17 (0.05-0.63) 0.47 (0.27-0.80) 0.49 (0.35-0.68) 0.01 0.01 <0.001 158/191 159/221 1.00 1.00 109/234 115/187 0.49 (0.35-0.69) 0.82 (0.59-1.14) 101/219 107/202 0.45 (0.32-0.65) 0.66 (0.47-0.93) 94/223 101/200 0.38 (0.25-0.56) 0.57 (0.38-0.84) <0.0001 <0.01 0.03 0.17 0.31 Breast cancer risk factor Body Mass Index, kg/m2 <25 25-<30 ≥30 Physical activity (mets/week) <4.4 4.4-<12 12-<25.5 ≥ 25.5 Age at menopause, yrs <50 50-<55 ≥55 a 1st quartile (reference) N OR Cases/ Controls 2nd quartile N Cases/ Controls OR (95% CI) Non-dense area b 3rd quartile N Cases/ Controls OR (95% CI) 4th quartile N Cases/ Controls OR (95% CI) p for trend P for interaction 0.07 252/343 89/88 11/15 1.00 1.00 1.00 110/210 98/186 35/56 0.71 (0.53-0.95) 0.50 (0.34-0.75) 0.83 (0.33-2.10) 78/163 86/176 62/107 0.65 (0.46-0.90) 0.44 (0.29-0.67) 0.76 (0.31-1.82) 36/114 89/144 98/189 0.42 (0.27-0.66) 0.54 (0.35-0.84) 0.65 (0.27-1.56) <0.0001 0.05 0.22 79/99 92/100 93/122 88/125 1.00 1.00 1.00 1.00 59/107 79/113 46/113 59/119 0.55 (0.34-0.90) 0.76 (0.49-1.18) 0.45 (0.28-0.71) 0.70 (0.45-1.09) 59/121 59/89 58/115 50/121 0.52 (0.31-0.85) 0.65 (0.40-1.06) 0.49 (0.30-0.78) 0.54 (0.33-0.87) 72/143 48/118 49/99 54/87 0.46 (0.27-0.80) 0.37 (0.22- 0.65) 0.48 (0.28-0.80) 0.78 (0.45-1.35) 0.02 <0.001 0.02 0.34 111/137 207/264 20/24 1.00 1.00 1.00 78/146 146/279 16/25 0.63 (0.43-0.94) 0.62 (0.46-0.82) 0.70 (0.27-1.85) 66/131 141/282 17/30 0.56 (0.37-0.87) 0.54 (0.40-0.73) 0.80 (0.30-2.17) 73/147 135/269 15/30 0.52 (0.33-0.82) 0.49 (0.35-0.70) 0.63 (0.22-1.82) 0.01 <0.001 0.45 Multivariate models in stratified analyses are adjusted for the following covariates (with the exception of the covariate used for stratification) : age at diagnosis (continuous, years), body mass index (continuous, kg/m2), age at menarche (<12, 12-13, or >13 years), parity and age at first birth (i.e., age at the end of the first pregnancy lasting ≥6 months, modeled as nulliparous, any number of children with age at birth<25 years, any number of children with age at birth ≥25 years), menopausal hormone therapy (never used hormones, current hormone use, past hormone use), age at menopause (50, 50–<55, ≥55 years), a family history of breast cancer (yes or no), a biopsy-confirmed history of benign breast disease (yes vs. no), alcohol consumption (0, <5, or ≥5 g/day), and smoking status (ever vs. never) b Non-dense area quartiles are defined as follows: 1st: <80 cm2; 2nd: 80-<133 cm2; 3rd: 133-<203 cm2; 4th: ≥203 cm2 c Multivariate models in stratified analyses are adjusted for the following covariates: age at diagnosis (continuous, years), body mass index (continuous, kg/m2), age at menarche (<12, 12-13, or >13 years), age at first birth (among parous only, continuous), menopausal hormone therapy (never used hormones, current hormone use, past hormone use), age at menopause (50, 50–<55, ≥55 years), a family history of breast cancer (yes or no), a biopsy-confirmed history of benign breast disease (yes vs. no), alcohol consumption (0, <5, or ≥5 g/day), and smoking status (ever vs. never) d Among parous women only; multivariate models in stratified analyses are adjusted for age at diagnosis (continuous, years), body mass index (continuous, kg/m2), age at menarche (<12, 12-13, or >13 years), age at first birth (continuous), menopausal hormone therapy (never used hormones, current hormone use, past hormone use), age at menopause (50, 50–<55, ≥55 years), a family history of breast cancer (yes or no), a biopsy-confirmed history of benign breast disease (yes vs. no), alcohol consumption (0, <5, or ≥5 g/day), and smoking status (ever vs. never) e Among parous women only; multivariate models in stratified analyses are adjusted for age at diagnosis (continuous, years), body mass index (continuous, kg/m2), age at menarche (<12, 12-13, or >13 years), parity (continuous), menopausal hormone therapy (never used hormones, current hormone use, past hormone use), age at menopause (50, 50–<55, ≥55 years), a family history of breast cancer (yes or no), a biopsy-confirmed history of benign breast disease (yes vs. no), alcohol consumption (0, <5, or ≥5 g/day), and smoking status (ever vs. never) 0.08 0.69
