Lecture 1. Introduction to Multivariate Data Analysis
advertisement
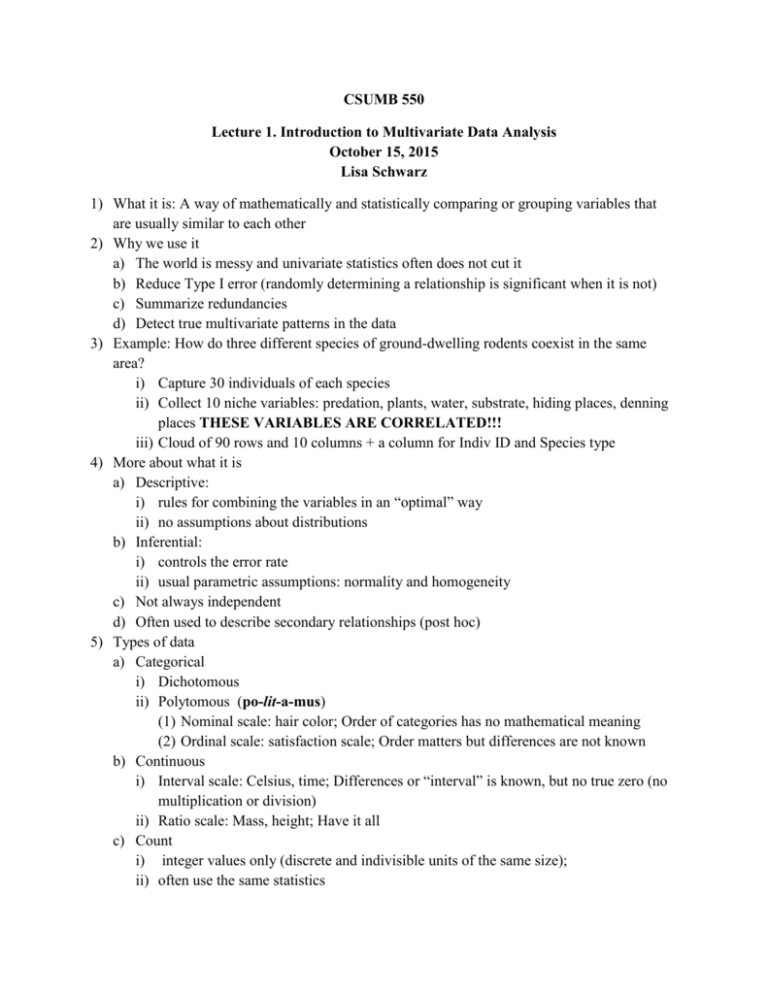
CSUMB 550 Lecture 1. Introduction to Multivariate Data Analysis October 15, 2015 Lisa Schwarz 1) What it is: A way of mathematically and statistically comparing or grouping variables that are usually similar to each other 2) Why we use it a) The world is messy and univariate statistics often does not cut it b) Reduce Type I error (randomly determining a relationship is significant when it is not) c) Summarize redundancies d) Detect true multivariate patterns in the data 3) Example: How do three different species of ground-dwelling rodents coexist in the same area? i) Capture 30 individuals of each species ii) Collect 10 niche variables: predation, plants, water, substrate, hiding places, denning places THESE VARIABLES ARE CORRELATED!!! iii) Cloud of 90 rows and 10 columns + a column for Indiv ID and Species type 4) More about what it is a) Descriptive: i) rules for combining the variables in an “optimal” way ii) no assumptions about distributions b) Inferential: i) controls the error rate ii) usual parametric assumptions: normality and homogeneity c) Not always independent d) Often used to describe secondary relationships (post hoc) 5) Types of data a) Categorical i) Dichotomous ii) Polytomous (po-lit-a-mus) (1) Nominal scale: hair color; Order of categories has no mathematical meaning (2) Ordinal scale: satisfaction scale; Order matters but differences are not known b) Continuous i) Interval scale: Celsius, time; Differences or “interval” is known, but no true zero (no multiplication or division) ii) Ratio scale: Mass, height; Have it all c) Count i) integer values only (discrete and indivisible units of the same size); ii) often use the same statistics 𝑦 = 𝛽0 + 𝛽1 𝑥1 + 𝛽2 𝑥2 + 𝛽3 𝑥3 + 𝛽4 𝑥4 a) x = independent, predictor, regressor, explanatory b) y = dependent, response, outcome c) Not applicable for some multivariate techniques = variables 7) Types of Techniques a) Ordination i) Principle Components Analysis, Factor Analysis, Multidimensional Scaling, Correspondence Analysis, Canonical Correspondence Analysis ii) Quantify the relationships between interdependent (correlated) variables and explain them in a smaller set of underlying dimensions iii) Condense the information into a smaller set of dimensions iv) Data (1) a single set of two or more continuous, categorical, and/or count variables (2) no distinction between independent and dependent variables b) Cluster Analysis i) develop meaningful aggregations or groups of entities ii) Data (1) a single set of two or more continuous, categorical, and/or count variables (2) no distinction between independent and dependent variables c) Discriminant Analysis – Logistic regression more common these days because of the assumptions i) Discriminant Analysis, Classification Rules, Multivariate Tests for Means (MANOVA), Classification and Regression Trees (CART) ii) Steps (1) Describe the differences among two or more well-defined groups (2) Predict which group a new entity will fall in to given its discriminating characteristics iii) Data (1) one categorical grouping with at least two levels (2) two or more continuous, categorical, and/or count variables (3) independent and dependent variables assigned based on sampling design and the research situation (MANOVA: predict continuous variable given the categorical variable) d) Canonical Correlation Analysis – Multivariate (normal) regression becoming more common these days, but very computationally difficult i) An extension of multiple regression analysis ii) Two or more sets of data where one set of data is the dependent variable (dependence can be arbitrary) iii) Each set has two or more continuous, categorical, and/or count variables 6)

