Interference and Dif..
advertisement
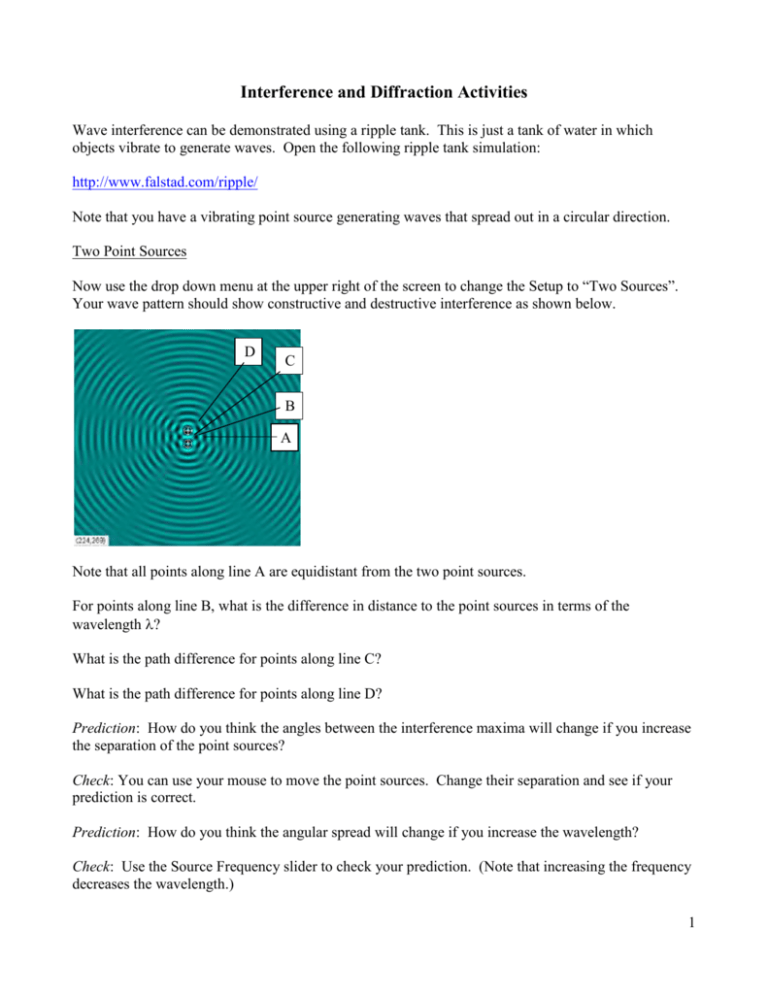
Interference and Diffraction Activities Wave interference can be demonstrated using a ripple tank. This is just a tank of water in which objects vibrate to generate waves. Open the following ripple tank simulation: http://www.falstad.com/ripple/ Note that you have a vibrating point source generating waves that spread out in a circular direction. Two Point Sources Now use the drop down menu at the upper right of the screen to change the Setup to “Two Sources”. Your wave pattern should show constructive and destructive interference as shown below. D C B A Note that all points along line A are equidistant from the two point sources. For points along line B, what is the difference in distance to the point sources in terms of the wavelength ? What is the path difference for points along line C? What is the path difference for points along line D? Prediction: How do you think the angles between the interference maxima will change if you increase the separation of the point sources? Check: You can use your mouse to move the point sources. Change their separation and see if your prediction is correct. Prediction: How do you think the angular spread will change if you increase the wavelength? Check: Use the Source Frequency slider to check your prediction. (Note that increasing the frequency decreases the wavelength.) 1 Prediction: Now, how do you think the wave pattern will change if you make the points oscillate 180o out of phase? Check: Check by moving the slider on the Phase Difference control (lower right) all the way to the right. For large distances from the sources compared to their separation, the angular positions of the interference maxima are given by m = d sin, where d is the separation of the point sources and m = 0, 1, 2, ... Explain how this formula is consistent with the simulation. Double Slit Change the setup from Two Sources to “Double Slit”. Describe what you observe. Is this similar to what you observed for Two Sources? Single Slit Now change the setup to “Single Slit”. Again, describe what you observe. How is this similar to the Double Slit pattern? How is it different? Single Slit Intensity Distribution Run this simulation to see how the intensity of light through a single slit varies with position when projected onto a screen. http://lectureonline.cl.msu.edu/~mmp/kap27/Gary-Diffraction/app.htm The positions of the minima (not maxima as for the double slit) are given by m = a sin, where a is the slit width and m = 1, 2, ... (not m = 0). 2 Set the slit width to a = 10 µm and the wavelength to = 500 nm. What is the angular position of the first minimum? = ________ deg Use the position of the first minimum shown in the intensity curve to calculate the distance from the slit to the screen. L = ________ m Double Slit Intensity Distribution Now run this simulation to see the intensity curve for light projected through a double slit onto a screen. http://lectureonline.cl.msu.edu/~mmp/kap27/Gary-TwoSlit/app.htm Set the slit separation to d = 30 µm, the slit width to a = 1 µm, and the wavelength to = 600 nm. (By making a << d, the two slits are effectively point sources.) Measure the angular position of the first maximum. = ________ deg Now use the position of the first maximum from the intensity curve to calculate the distance to the screen. L = ________ m 3

