Multivariate analysis of electrophysiological diversity of Xenopus
advertisement
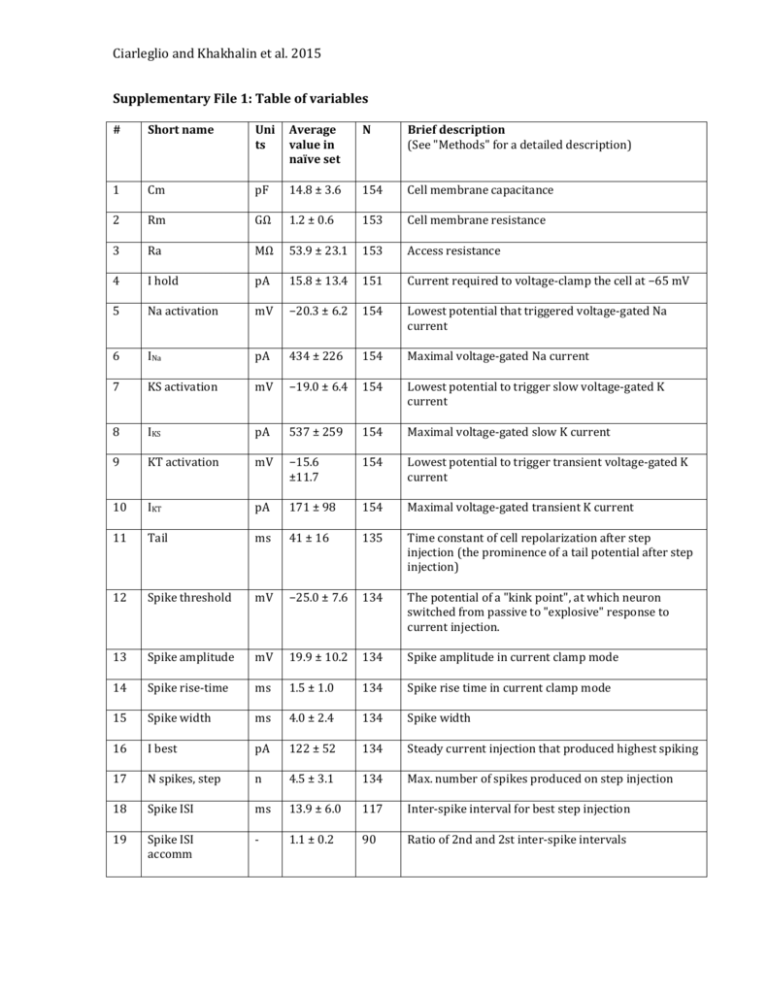
Ciarleglio and Khakhalin et al. 2015 Supplementary File 1: Table of variables # Short name Uni ts Average value in naïve set N Brief description (See "Methods" for a detailed description) 1 Cm pF 14.8 ± 3.6 154 Cell membrane capacitance 2 Rm GΩ 1.2 ± 0.6 153 Cell membrane resistance 3 Ra MΩ 53.9 ± 23.1 153 Access resistance 4 I hold pA 15.8 ± 13.4 151 Current required to voltage-clamp the cell at −65 mV 5 Na activation mV −20.3 ± 6.2 154 Lowest potential that triggered voltage-gated Na current 6 INa pA 434 ± 226 154 Maximal voltage-gated Na current 7 KS activation mV −19.0 ± 6.4 154 Lowest potential to trigger slow voltage-gated K current 8 IKS pA 537 ± 259 154 Maximal voltage-gated slow K current 9 KT activation mV −15.6 ±11.7 154 Lowest potential to trigger transient voltage-gated K current 10 IKT pA 171 ± 98 154 Maximal voltage-gated transient K current 11 Tail ms 41 ± 16 135 Time constant of cell repolarization after step injection (the prominence of a tail potential after step injection) 12 Spike threshold mV −25.0 ± 7.6 134 The potential of a "kink point", at which neuron switched from passive to "explosive" response to current injection. 13 Spike amplitude mV 19.9 ± 10.2 134 Spike amplitude in current clamp mode 14 Spike rise-time ms 1.5 ± 1.0 134 Spike rise time in current clamp mode 15 Spike width ms 4.0 ± 2.4 134 Spike width 16 I best pA 122 ± 52 134 Steady current injection that produced highest spiking 17 N spikes, step n 4.5 ± 3.1 134 Max. number of spikes produced on step injection 18 Spike ISI ms 13.9 ± 6.0 117 Inter-spike interval for best step injection 19 Spike ISI accomm - 1.1 ± 0.2 90 Ratio of 2nd and 2st inter-spike intervals Ciarleglio and Khakhalin et al. 2015 20 Spike accomm. - 2.3 ± 1.3 117 Spike amplitude accommodation. 21 N spikes, cosine n 0.7 ± 0.4 108 Max. number of spikes produced on cosine injection 22 Spiking resonance ms 43 ± 10 108 Cosine injection period that produced highest spiking 23 Spiking resonance width pA 53 ± 52 108 A measure of non-saturation of spike output in response to slower cosine injections (a measure of non-inactivation) 24 Wave buildup n 9.7 ± 5.8 108 Cosine "bump" by which the cell reached highest spiking 25 Wave decay n 35 ± 64 108 A measure of spiking inactivation: decay constant for spiking in response to consecutive cosine "bumps" 26 Jitter - 0.1 ± 0.1 108 Spike-timing jitter coefficient during cosine injections 27 Synaptic resonance ms 52.5 ± 76.3 76 Inter-stimulus interval that evoked maximal total synaptic response (total charge) 28 Synaptic resonance width ms 90 ± 85 76 Sharpness of non-linear summation as a function of inter-stimulus interval (high value = low dependency) 29 Synaptic charge nA· s 16.8 ± 18.0 76 Maximal total synaptic charge 30 Synaptic PPF - 2.4 ± 1.5 76 A measure of synaptic non-linear summation 31 Monosynapticity - 3.1 ± 2.8 76 Ratio of monosynaptic to polysynaptic responses 32 Minis frequency Hz 4.8 ± 4.4 64 Frequency of spontaneous excitatory postsynaptic currents 33 Minis amplitude pA 5.0 ± 2.1 64 Mean amplitude of excitatory postsynaptic currents

