How to Interpret Guide
advertisement

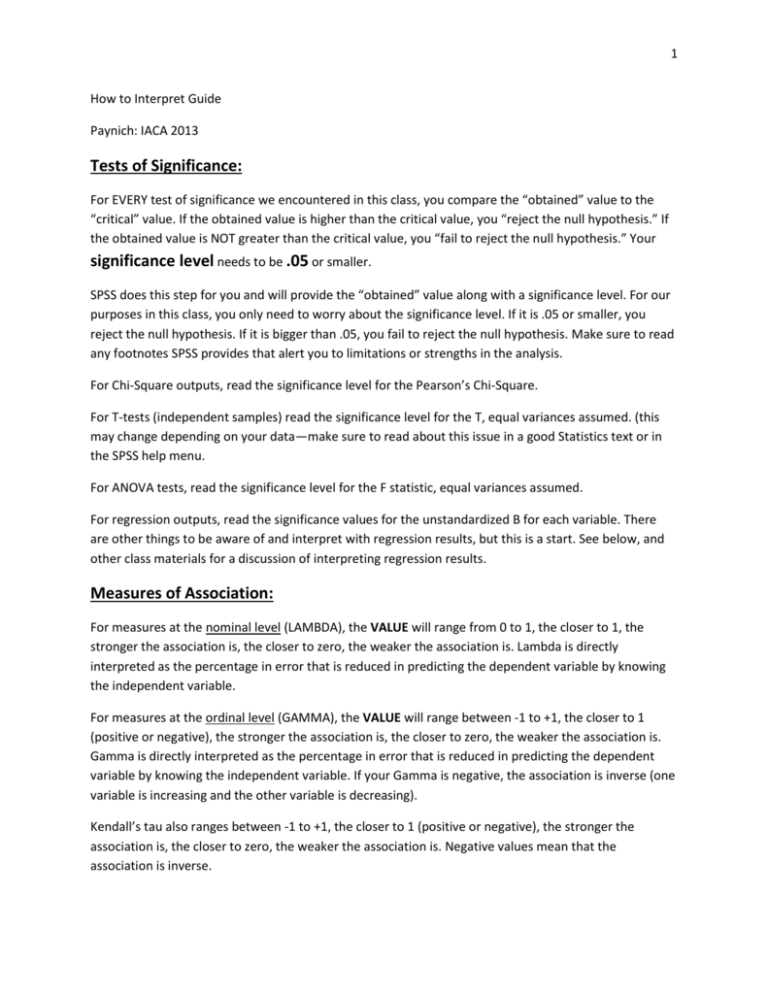
1 How to Interpret Guide Paynich: IACA 2013 Tests of Significance: For EVERY test of significance we encountered in this class, you compare the “obtained” value to the “critical” value. If the obtained value is higher than the critical value, you “reject the null hypothesis.” If the obtained value is NOT greater than the critical value, you “fail to reject the null hypothesis.” Your significance level needs to be .05 or smaller. SPSS does this step for you and will provide the “obtained” value along with a significance level. For our purposes in this class, you only need to worry about the significance level. If it is .05 or smaller, you reject the null hypothesis. If it is bigger than .05, you fail to reject the null hypothesis. Make sure to read any footnotes SPSS provides that alert you to limitations or strengths in the analysis. For Chi-Square outputs, read the significance level for the Pearson’s Chi-Square. For T-tests (independent samples) read the significance level for the T, equal variances assumed. (this may change depending on your data—make sure to read about this issue in a good Statistics text or in the SPSS help menu. For ANOVA tests, read the significance level for the F statistic, equal variances assumed. For regression outputs, read the significance values for the unstandardized B for each variable. There are other things to be aware of and interpret with regression results, but this is a start. See below, and other class materials for a discussion of interpreting regression results. Measures of Association: For measures at the nominal level (LAMBDA), the VALUE will range from 0 to 1, the closer to 1, the stronger the association is, the closer to zero, the weaker the association is. Lambda is directly interpreted as the percentage in error that is reduced in predicting the dependent variable by knowing the independent variable. For measures at the ordinal level (GAMMA), the VALUE will range between -1 to +1, the closer to 1 (positive or negative), the stronger the association is, the closer to zero, the weaker the association is. Gamma is directly interpreted as the percentage in error that is reduced in predicting the dependent variable by knowing the independent variable. If your Gamma is negative, the association is inverse (one variable is increasing and the other variable is decreasing). Kendall’s tau also ranges between -1 to +1, the closer to 1 (positive or negative), the stronger the association is, the closer to zero, the weaker the association is. Negative values mean that the association is inverse. 2 Spearman’s rho also ranges between -1 to +1, the closer to 1 (positive or negative), the stronger the association is, the closer to zero, the weaker the association is. Negative values mean that the association is inverse. Squaring the value turns it into a PRE measure that is interpreted similar to GAMMA. This can be used on ordinal and interval variables. For measures at the interval level (Pearson’s R), the VALUE will range between -1 to +1, the closer to 1 (positive or negative), the stronger the association is, the closer to zero, the weaker the association is. If your Pearson’s R is negative, the association is inverse (one variable is increasing and the other variable is decreasing). If you square the Pearson’s value, you get the coefficient of determination that is directly interpreted as the percentage of the variation of your dependent variable that is explained by your independent variable. Regression Equations: The first thing to look at is whether or not the overall model is significant. Look at your significance level of F. (In the ANOVA box). If it is .05 or smaller, you have a significant model. The second thing to look at is the R2; multiply the value by 100 and interpret it as the percentage in the variance of your dependent variable that is explained by your independent variables in total (your model). The closer to 0, the weaker your model is, the closer to 1 the stronger your model is. The third thing to look at is the significance levels for your beta coefficients (B). Again, you need a significance level of .05 or smaller to achieve a significant relationship. The fourth thing is looking at the actual coefficient values themselves. For unstandardized beta coefficients, the value is directly interpreted to be the exact change in Y with a one unit increase in X. So if your unstandardized Beta Coefficient is .25, it means that as X increases by 1, the corresponding change in Y is a .25 increase. For dichotomous variables, the beta is interpreted as more or less likely rather than a direct unit impact. For standardized beta coefficients, basically, the largest one wins—ignore the sign, multiply the standardized value by 100 and that is the percentage of variance in the model that the independent variable predicts.


