Fig. S8 Probability frequency distribution of raw material transport
advertisement
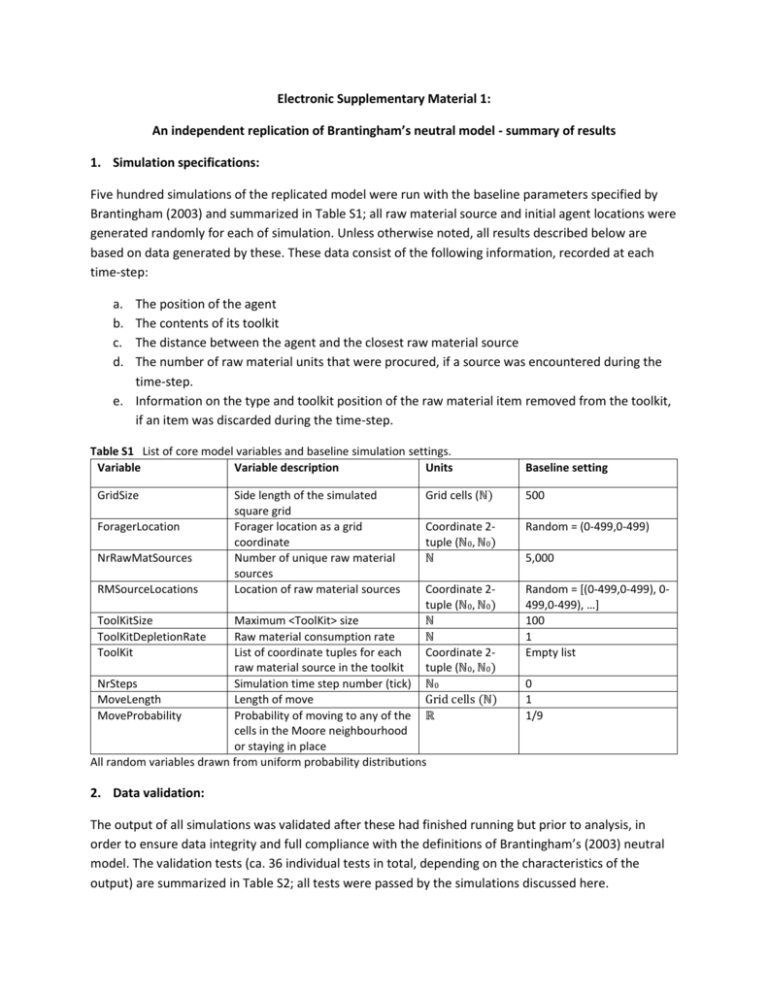
Electronic Supplementary Material 1: An independent replication of Brantingham’s neutral model - summary of results 1. Simulation specifications: Five hundred simulations of the replicated model were run with the baseline parameters specified by Brantingham (2003) and summarized in Table S1; all raw material source and initial agent locations were generated randomly for each of simulation. Unless otherwise noted, all results described below are based on data generated by these. These data consist of the following information, recorded at each time-step: a. b. c. d. The position of the agent The contents of its toolkit The distance between the agent and the closest raw material source The number of raw material units that were procured, if a source was encountered during the time-step. e. Information on the type and toolkit position of the raw material item removed from the toolkit, if an item was discarded during the time-step. Table S1 List of core model variables and baseline simulation settings. Variable Variable description Units GridSize ForagerLocation NrRawMatSources RMSourceLocations ToolKitSize ToolKitDepletionRate ToolKit Side length of the simulated square grid Forager location as a grid coordinate Number of unique raw material sources Location of raw material sources Baseline setting Grid cells (ℕ) 500 Coordinate 2tuple (ℕ0, ℕ0) ℕ Random = (0-499,0-499) Coordinate 2tuple (ℕ0, ℕ0) ℕ ℕ Coordinate 2tuple (ℕ0, ℕ0) ℕ0 Grid cells (ℕ) ℝ Random = [(0-499,0-499), 0499,0-499), …] 100 1 Empty list Maximum <ToolKit> size Raw material consumption rate List of coordinate tuples for each raw material source in the toolkit NrSteps Simulation time step number (tick) MoveLength Length of move MoveProbability Probability of moving to any of the cells in the Moore neighbourhood or staying in place All random variables drawn from uniform probability distributions 5,000 0 1 1/9 2. Data validation: The output of all simulations was validated after these had finished running but prior to analysis, in order to ensure data integrity and full compliance with the definitions of Brantingham’s (2003) neutral model. The validation tests (ca. 36 individual tests in total, depending on the characteristics of the output) are summarized in Table S2; all tests were passed by the simulations discussed here. Table 2 Summary of validation tests conducted on simulation outputs. Output component Test description Integrity of utilized raw material sources data Integrity of toolkit state data Integrity of discard record data Agent positions Distances between the agent and the nearest sources Raw material procurement The source file utilized by the simulation contains the requested number of sources. All entries in the utilized source file are located within the bounds of the simulated environment, and are all unique. The data file contains the correct number (and types) of variables. Time-step data are sequential (incremented by one). The number of input events in the discard record matches the number of discard events recorded in the toolkit state data. The timing of the input events matches the timing of discard events in the toolkit states data, and the items entering the discard record are identical to those discarded from the toolkit The coordinates in the discard record data match the location of the agent as recorded in the toolkit state data for all discarded items. Changes in the position of the agent along incremental time-steps are consistent with movements in Moore neighbourhoods (i.e. the agent only moves to adjacent cells). There is no significant difference between agent position changes and movement probabilities derived from a uniform random distribution with 9 possible outcomes (chisquare test). The uniformity of the distribution of p values across all simulations was checked. At least one source listed in the source output file is located at the recorded distance from the agent at each time-step, and no source is found in closer proximity to the agent. Procurement events are recorded only at time-steps where the agent’s position matches that of one of the raw material sources listed in the source output file. The number of procured raw material units (the toolkit size at the current time-step minus the toolkit size at the previous time-step) is equal to the specified maximum toolkit size minus the number of items currently in the toolkit The toolkit is always full at time-steps when the agent’s position matches the location of a raw material source listed in the source output file. Only one source, which corresponds to the source indicated by the agent’s current position, is represented in the procured materials. Raw material discard No discard event recorded in time-steps where toolkit is empty. Item(s) are always discarded at time-steps when the toolkit is not empty. The number of discarded items matches specified discard rates. The toolkit size recorded in the discard information variables matches the size of the toolkit in the previous time-step. The type of the discarded raw material unit matches the type of the unit at the index indicated by the discard information variables in the previous time-step. The number of units of the discarded type in the previous time-step is the same as the specified discard rate (one), accounting for source encounters. Discard and Sequential differences in toolkit sizes are explainable by procurement and discard Procurement behaviours. Simulation end The last move attempt would have placed the agent beyond the boundaries of the conditions simulated environment (edge encounter), or the agent moved to the location of an unvisited source after having visited 199 unique sources (source encounter). Note that the randomness of resource placement, though not tested, conforms to theoretical expectations (Figure S2). All tests were conducted in R 3. Preliminary observations: A number of problems were identified during the re-implementation of Brantingham’s model. The first of these pertains to Brantingham’s discussion of “foraging areas,” which he defines as the “area[s] around a raw material source that can be effectively exploited with material from that source [and are] thus defined by radius d” (Brantingham 2003: 495; italics in original). This concept of foraging area is problematic in the context of a model which uses square tiling and allows for diagonal movements without penalty because the area defined by the radius is square, not circular (i.e. a forager can move diagonally over 10 grid cells in 10 time steps). Consequently, in the context of his model an area of radius d=10 (20x20 cells) will measure 400 grid cells and will contain an average of 8 raw material sources at a resource density of 0.02 sources per grid cell (i.e. 5000 sources on a 500x500 grid); conversely, if linear distances are considered, the area defined by that radius would be 314.16 grid cells, containing on average only 6.2 raw material sources. In short, using linear distances to derive foraging radii and average source densities (e.g. Brantingham 2003: 495-496) is not consistent with the definitions of the model. To ascertain the actual mean of the distribution of agent displacement distances after 100 moves (i.e. the time it would take for a full toolkit to be cleared if no sources are encountered), which represents, according to Brantingham (2003: 495), the foraging radius d, a simple model was run a million times. In the simulations, which occurred on a 500x500 grid, the agent was placed at the center of the grid (x=250, y=250) and allowed to move randomly (1/9 probability of moving to a neighbouring cell or staying put) for 100 time steps. At the end of each simulation the minimum number of time-steps required to return to the point of origin was recorded. The resulting distribution (Figure S1) has a mode of 7, a median of 9, and a mean of 9.213, which is, as expected, somewhat lower than the number (10) used by Brantingham. More importantly, Figure S1 shows not only that the range of possible displacement values is high, but also that the distribution is skewed and, as indicated by the central tendency values listed above, most observations fall below the mean; thus, it could be argued that the modal or most frequently observed value of 7, rather than the mean, should be used as a proxy for the size of the foraging radii. In any case, it is clear that only probabilistic estimates of, rather than absolute values for, foraging radii can be given. A second problem pertains to Brantingham’s calculation of the maximum number of unique raw material types that can be expected in a toolkit. He suggests that this number “can be estimated empirically from the maximum number of unique sources that might be found within a foraging area of radius d” (2003: 495). On the one hand his calculations are incorrect because they are based on linear distances which, as discussed above, are not applicable in the context of his model; on the other hand, it must be noted that the maximum resource density in an area of a given size is not fixed - it will vary between simulated environments, and therefore it cannot be predicted in absolute terms a priori. Indeed, there is a non-zero (albeit infinitesimally small) probability that an arbitrarily large area will be fully covered with sources provided that the number of sources is larger than the number of cells in that area, and that the distribution is indeed random (i.e. not uniform). Fig. S1 Probability of traversing a given distance, where distance is defined as the minimum number of steps required to return to the starting location, using a random walk with 1/9 probabilities of moving to cells in the Moore neighborhood or staying in place. The figure summarizes 1 million runs (100 million time-steps) For any given area the density of randomly distributed sources follows a Poisson distribution. Using Brantingham’s displacement figure (d=10) and default resource density parameter (0.02 sources per cell), the foraging area in a square grid world would be 400 grid cells, and the λ parameter of the probability distribution would be 8. As shown in Figure S2, the probability of observing resource densities higher than the maximum suggested by Brantingham, namely 11, is relatively high; moreover, as also shown in the figure, the observed distribution of sources across the 500 main simulations run with the same density parameter closely matches this theoretical distribution. Since the density of local clusters cannot be predicted a priori except in probabilistic terms, the logic behind Brantingham’s (2003: 496) calculations is difficult to follow, given that in the context of a single simulation the actual maximum density of sources does not have to be predicted – it can be computed with perfect accuracy. A third problem arises from the fact that, if only probabilistic estimates of the foraging areas and maximum source densities can be given, it stands to reason that the maximum richness of toolkits will depend, to a certain degree at least, on the length of the simulations, as longer simulations have a higher chance of producing low likelihood events. As expected, data from the 500 main simulations show a strongly positive and highly significant correlation between these variables (Kendall’s τ = 0.548, p < 2.2e-16), which suggests that arbitrarily ending the simulations upon encountering 200 unique sources, or upon encounters with the edges of the grid, may have biased Brantingham’s analyses. In any case, as calculated by Brantingham, the maximum attainable toolkit richness state is a more or less arbitrary number from the upper tail of the probability distribution, one which represents neither the theoretical maximum nor the expected average maximum that would be observed over a large number of, or longer, simulations. The strong correspondence between the values observed and predicted by Brantingham is therefore due to chance (cf. Table 2 and related discussion in Brantingham 2003: 496). Fig. S2 Predicted and observed probability of a given number of raw material sources being allocated in an area of 400 grid cells, with source densities set to 0.02 (5000 sources randomly placed on a 500 × 500 grid). The observed probabilities were computed from 500 simulated environments, each split into 625 squares of 400 grid cells (n = 312,500). Note that the actual probability of observing the average value (8) is only about 14 % 4. Replication results: 4.1. General characteristics of the simulations: The duration of individual simulations was highly variable, ranging from a minimum of one time-step to a maximum of 50866 (median = 13234, IQR = 27323), for a cumulative total of 8.11 million time-steps. The majority were terminated upon encounters with the edges of the simulated world (n=362, or 72.4%), although longer simulations were predictably terminated more frequently due to encounters with 200 unique raw material sources (Figure S3). These relatively short simulations allowed the agents to cover only small areas of the grid, the maximum number of unique cells visited by an agent in a single simulation being only 12094 (median=4429.5, IQR=8387), or ca. 4.84% of the total space available to them. One consequence of such low coverage is that, in the context of a random (as opposed to uniform) distribution of resources, which guarantees variability in the clustering of sources at a local scale (Figure S2), conclusions drawn from but a handful of simulations may be unreliable. Fig. S3 Distributions of simulation lengths by termination conditions. Data from all 500 simulations is included In terms of the number of sources visited by the simulated agents, the values varied between a minimum of 0 and a maximum of 969, with a median of 273.5 (IQR=550.25). This is consistent with the number of source encounters reported by Brantingham (2003: 499) for one simulation, namely 513. The agents seldom wandered far from raw material sources, being found most often at a distance of but two to three cells from the one nearest to them, and only very rarely at distances of 10 grid cells or more (Figure S4). While not surprising given the high density of sources - the linear average nearest neighbour distance between these was only 3.61 (SD=0.025)1 – the ratio between the median number of simulation steps and the median number of visited sources is very high (ca. 48), indicating that source encounters are relatively rare. 1 Note that this number is higher than would be expected from nearest neighbour analysis (Clark and Evans 1954, 1979), regardless of whether correction factors (e.g. Donnelly 1978) are used or not. This is because such analysis is based on linear distances between neighbours, and cannot be used in the context of Brantingham’s model, as sources are allocated on discrete rather than continuous space. In such discrete space the minimum possible distance between two sources is not fixed (i.e. the distance to an adjacent source can be one if the source is at the left, for example, but it will be 1.41 if located at the top-left). Thus, the discrepancy between observed and expected nearest neighbour values is not indicative of a non-random distribution of sources (see Figure S2). Fig. S4 Frequency of observed distances between the simulated agent and the nearest raw material sources, expressed as the average percentage (±1 SD) of simulation time over all 500 simulations 4.2. Mobile toolkit states: With respect to the mobile toolkits, these were in an empty state between 0 and 100% of the simulation times, with a median of 35.13 (IQR=8.62) and a mean of 38.32 percent (SD=17.03); if only those simulations lasting 10000 time-steps or more (n=281) are considered, the percentage of simulation time spent in an empty toolkit state ranges from a minimum of 22.73 to a maximum of 44.67 percent, with a median of 34.58 (IQR=5.7) and a mean of 34.65 (SD=4.11) percent. Brantingham (2003: 494) reported that in a representative simulation the toolkit was empty approximately 25 percent of simulation time; while that value falls within the range of variability observed here, it is not representative of the overall results (Figure S5a). The large number of time-steps spent without access to lithic raw materials could be problematic if one were to assume that such access was critical to forager survival. More important than empty toolkit occurrences, however, are the lengths of periods spent in such a state. The aggregated data from all 500 simulations (Figure S5b) indicates that the lengths of consecutive empty toolkit states were most frequently quite short (<20 time steps), but also that the probability of observing longer sequences is very high (81.2 percent for periods of 20 time-steps or longer, 15.6 percent for periods of 200 time-steps or more); indeed, the average length of empty toolkit periods was 108.75 (median=70), and the maximum recorded length was 1869. These numbers are surprisingly high given the density of sources (see above), and bring into question the survivability of foragers under Brantingham’s neutral model2. 2 This was noted by Oestmo et al. (2014) also, but they investigated simulations run with non-random, clustered sources. In fact, as shown here, the presence of such clustered sources is not necessary to bring into question the survivability of Brantingham’s foragers. Fig. S5 a Frequency of empty toolkit occurrences across 281 simulations lasting 10,000 time-steps or more, expressed as a percentage of simulation time, and b the probability of observing sequential empty toolkit states of a given length. Subplot b includes all sequential empty toolkit state observations (n = 25,923) from all 500 simulations, binned in intervals of 20 time-steps As expected given these observations, the modal average toolkit richness state observed across all simulations is zero (Figure S6a). From this modal value the distribution of mean richness state frequencies follows a smooth decline curve up to a maximum of 13 unique raw material types, and has a median value of 1 (IQR=2). This distribution is qualitatively similar to that reported by Brantingham for a single simulation (Figure 6 in Brantingham 2003: 494), although as expected given his flawed calculations of maximum attainable richness states (see section S1.3 above) and the uncommonly low frequencies of empty toolkit states reported for the simulations, there are slight differences in the median and maximum values. Overall, most simulations only attained a maximum richness state of 8 unique raw material types (Figure S6b), although the median maximum observed richness was somewhat lower at 7 (IQR = 3). As noted by Brantingham (2003: 498), the maximum number of unique raw material types increases with the log of the amount of material in the toolkit. As shown in Figure S7, a virtually identical relationship can be observed in the output of the simulations discussed here (compare with Figure 8 in Brantingham 2003: 498); Figure S7 also shows, however, that all combinations of toolkit size and raw material richness can be observed, and that the overall relationship between the two variables is rather different. Fig. S6 a Average (±1 SD) simulation time spent in different toolkit richness states, and b the frequency of maximum attained toolkit richness states across all 500 simulations Fig. S7 Relationship between toolkit raw material richness and toolkit size in the aggregated data from all simulations. Black diamonds indicate maximum toolkit richness values attained at each toolkit size; as observed by Brantingham (2003: 498), a strong positive correlation (r2 = 0.927, p < 2.2e−16) between these maximum richness values and the log of the quantity of materials in the toolkits can be observed (black regression line). However, the overall relationship between the two variables is much less clear when all data points are considered (n = 5.29 million). These data points are represented here as circles whose size increases with the cube root of the number of observations for a given combination, so as to account for the extreme differences (the number of observations per combination ranges from 1 to 50719) 4.3 Transport distances: The average transport distance patterns that result from combining the outputs of all 500 simulations (Figure S8) are qualitatively very similar to those observed by Brantingham (2003: 499); although the frequency of items found at their source is considerably higher when toolkits are sampled only at encounters with sources (Figure S8b), sample size effects and Brantingham’s choice of histogram bin widths likely account for much of the difference. The maximum transport distance of 61 grid cells is also higher than observed by Brantingham (2003: 499), but this is expected given the probabilistic nature of the phenomena under consideration and the much larger number of observations (n=333.7 million versus less than 20000). Importantly, and as predicted by Brantingham (2003: 499), the modal transport distance across all observations (3 grid cells) is identical to the “internal mode” evidenced when only observations at raw material sources are considered. Fig. S8 Probability frequency distribution of raw material transport distances recorded in the mobile toolkits throughout the length of the 500 simulations, when a all data points are considered (n = 333.73 million) and b when toolkits are sampled at raw material sources (n = 159.83 million) The pattern of decay in the quantity of a given raw material type with increasing distance from its source (Figure S9) is also qualitatively similar to that reported by Brantingham (cf. Figure 11 in Brantingham 2003); indeed, although the mean values vary somewhat from those reported by him, they fall well within one standard deviation from these. Some differences were also noted, however, and these bring into question two fundamental relationships predicted by Brantingham. First, Brantingham (2003: 499) predicted that the modal/median transport distances will fall in the interval [d/2,d], where d is the foraging radius (10 for the default simulation parameters); the modal value obtained here falls outside of this range, while the Fig. S9 Quantity of items in the mobile toolkit as a function of distances from their source. Data represent the averaged (±1 SD) frequencies recorded in the 500 simulations median (5 grid cells) corresponds to its lower limit3. Secondly, Brantingham (2003: 500) predicted that the maximum transport distance should be approximately three to four times the radius d, although subsequently he states that the maximum distance is expected to be three to four times the mode (Brantingham 2003: 501-506). Notwithstanding this confusion, which has implications for Brantingham’s (2003: 501-504) analyses of archaeological parallels4, it can be noted that the maximum distance observed in the output of the 500 simulations discussed here is over 20 times larger than the mode5, 3 Note that the modal and median values reported by Brantingham do fall within the range of variability observed in the outputs of individual simulations; thus two simulations (0.4%) attained a median value of 9 (the maximum observed), and 22 simulations (4.4%) attained modal values equal to, or greater than, 5 (observed maximum = 11). Note also that the overall median value reported here was computed from a random sample (with replacement) of one million data points. 4 Brantingham (2003: 498-499) reported a modal transport distance of 5 and a maximum of 43 grid cells; using these values, the maximum transport distance is 8.6 times larger than the mode, not 3-4 times as stated by the author. In the archaeological parallels discussed by Brantingham (Grotte Vaufrey and the Middle Palaeolithic record of Central Europe) the reported maximum transport distances are 2 and 4.6-6 times larger than the modes, falling well below the expected values. More importantly, Brantingham reported that the probability of observing a transport distance of 10 grid cells or more, which would be equivalent to twice the mode, is approximately 33 percent (see caption to Figure 10 in Brantingham 2003: 500). Thus, according to Brantingham’s predictions, 33 percent of the artifacts recovered from Grotte Vaufrey would be expected to have been transported from a distance that is equivalent to, or greater than, the actual maximum observed. It is also telling, of course, that the maximum transport distances reported for the entire Middle Palaeolithic of Central Europe fall below the predictions of short (i.e. low sample size) simulations. 5 Note that the probability of observing transport distances greater than 9 and 12 grid cells (i.e. three and four times the modal value observed in the aggregated data from the 500 simulations) are 16.9 and 7.9 percent respectively. In effect, this means that, using the figures obtained here, approximately 8 out of every 100 raw and approximately 6 times higher than Brantingham’s analytically derived foraging radius d. In fact, 126 simulations, or 25.2% of the total, yielded maximum transport distances greater than Brantingham’s maximum predicted distance of 40 (four times radius d). Be that as it may, Brantingham’s observation that “median and modal transport distances do not change appreciably with different environmental raw material densities” (2003: 499) is accurate. An additional 200 simulations, run with source density parameters of 0.002 (500 sources) and 0.06 (15000 sources) respectively confirmed Brantingham’s assertion that in cases of low raw material densities the “distribution loses its right skew and clusters more tightly around the [center]” (Brantingham 2003: 499). Across these simulations I observed a shift in modal and median values from 2 to 3, and 4 to 5 respectively, which for all practical purposes can be considered as minor. It should be noted, however, that the increased clustering around the modal and median values does imply that, under conditions of lower source densities, the probability of observing lower maximum transport distances is higher. In other words, the neutral model predicts that, all else being equal, maximum transport distances under conditions of lower raw material source densities should be lower than under conditions of higher source densities. 5. Summary of findings: The patterns generated by the replicated model discussed here are qualitatively similar to those reported by Brantingham, and all values reported by that author fall within the range of variability evidenced in my simulations. However, his values are seldom representative (e.g. Brantingham’s reported median transport distance is higher than the median observed in 99.6% of the 500 simulations), rendering several of Brantingham’s conclusions problematic. In particular, I could not replicate the postulated relationship between modal and maximum transport distances, nor that between median/modal transport distances and the size of the foraging radius. The use of methods incompatible with the definitions of the model (e.g. those relying on linear distances) also renders some of Brantingham’s analyses problematic; such is the case, for example, with his calculations of maximum toolkit richness states and of the size of foraging areas. In general the simulation lengths and outputs were highly variable, and the probability of observing representative patterns across all investigated relationships in the context of a single or small number of simulations is low. This is mainly due to the arbitrary termination conditions stipulated by Brantingham, which result in a very low degree of coverage of the simulated environment and therefore in a high susceptibility to local differences in the placement of raw material sources. In this regard it should be pointed out that, although the average number of sources found in an area of radius 10 is 8, the actual probability of observing such an average value is only about 14% (see Figure S2). The arbitrary end conditions also make it difficult to establish the actual parameters of the various distributions, because very short simulations, virtually always terminated by encounters with the edges of the simulated world (Figure S3), have undue weight. For example, the means and standard deviations material units (e.g. artifacts) are expected to have been transported over a greater distance than the maximum predicted. of the percentages of simulation time spent in an empty toolkit state change considerably depending on whether all simulations or only those lasting longer than 10000 time-steps are considered (see section 4.2 above). While it could be argued that only simulations above a certain length should be included in analyses, it is unclear what that threshold should be; at the very least simulations should be allowed to continue until the agent achieves complete or near complete coverage of the grid. Aside from these issues, and as noted by Oestmo et al. (2014) also, the survivability of foragers under Brantingham’s neutral model is questionable, since the simulated agents do not have any access to raw materials for relatively long periods. This is a natural outcome of employing random walk strategies, which cannot guarantee constant access to resources. Consequently, if it can be assumed that people required constant access to lithic raw material sources in the past, the mobility strategy employed by Brantingham’s model cannot be used, and either a fully non-random or semi-random (i.e. random movement until certain condition is met) mobility strategy should be modeled instead. References Brantingham, P. J. (2003). A Neutral Model of Stone Raw Material Procurement. American Antiquity, 68(3), 487-509. Clark, P. J., and Francis C. Evans (1954). Distance to Nearest Neighbor as a Measure of Spatial Relationships in Populations. Ecology, 35(4), 445-453. Clark, P. J., and Francis C. Evans (1979). Generalization of a Nearest Neighbor Measure of Dispersion for Use in K Dimensions. Ecology, 60(2), 316-317. Donnelly, K. P. (1978). Simulations to determine the variance and edge effect of total nearest-neighbour distance. In I. Hodder (Ed.), Simulation Studies in Archaeology (pp. 91-95). Cambridge: Cambridge University Press. Oestmo, S., Marco A. Janssen, and Curtis Marean (2014). The Effect of Spatial Clustering on Stone Raw Material Procurement. Paper presented at the Advances in Computational Social Science and Social Simulation, Barcelona: Spain.


