Name: Date: Period: CHS Statistics MINITAB Assignment Starbucks
advertisement
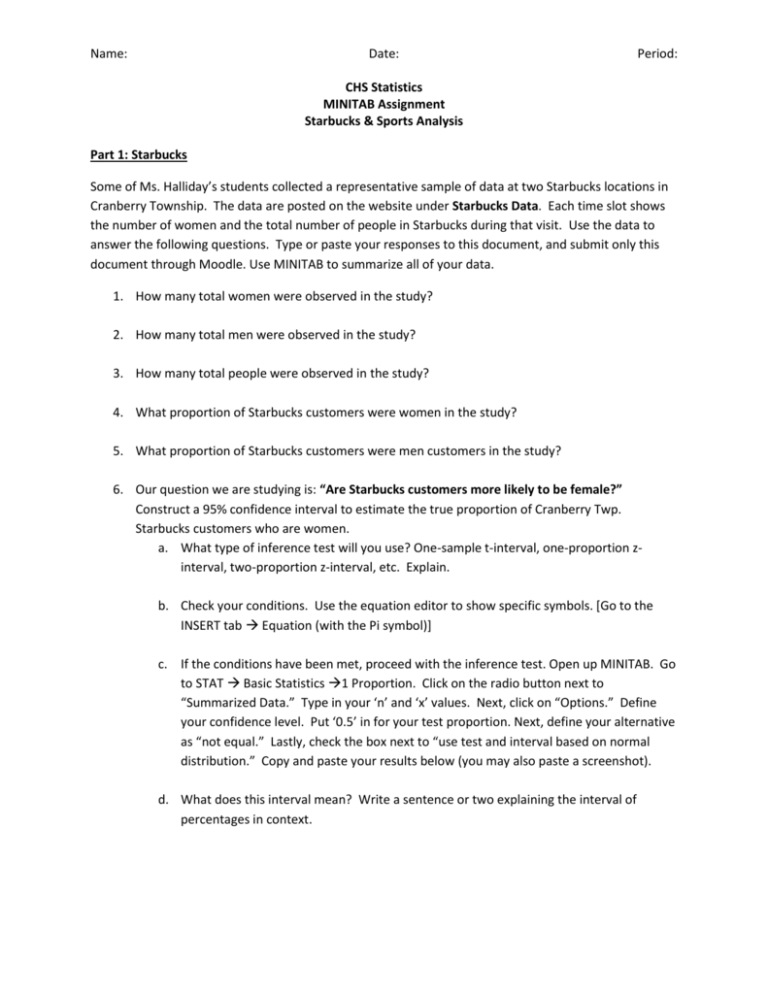
Name: Date: Period: CHS Statistics MINITAB Assignment Starbucks & Sports Analysis Part 1: Starbucks Some of Ms. Halliday’s students collected a representative sample of data at two Starbucks locations in Cranberry Township. The data are posted on the website under Starbucks Data. Each time slot shows the number of women and the total number of people in Starbucks during that visit. Use the data to answer the following questions. Type or paste your responses to this document, and submit only this document through Moodle. Use MINITAB to summarize all of your data. 1. How many total women were observed in the study? 2. How many total men were observed in the study? 3. How many total people were observed in the study? 4. What proportion of Starbucks customers were women in the study? 5. What proportion of Starbucks customers were men customers in the study? 6. Our question we are studying is: “Are Starbucks customers more likely to be female?” Construct a 95% confidence interval to estimate the true proportion of Cranberry Twp. Starbucks customers who are women. a. What type of inference test will you use? One-sample t-interval, one-proportion zinterval, two-proportion z-interval, etc. Explain. b. Check your conditions. Use the equation editor to show specific symbols. [Go to the INSERT tab Equation (with the Pi symbol)] c. If the conditions have been met, proceed with the inference test. Open up MINITAB. Go to STAT Basic Statistics 1 Proportion. Click on the radio button next to “Summarized Data.” Type in your ‘n’ and ‘x’ values. Next, click on “Options.” Define your confidence level. Put ‘0.5’ in for your test proportion. Next, define your alternative as “not equal.” Lastly, check the box next to “use test and interval based on normal distribution.” Copy and paste your results below (you may also paste a screenshot). d. What does this interval mean? Write a sentence or two explaining the interval of percentages in context. 7. Now conduct a hypothesis test to test the claim that a majority of Starbucks customers are female. a. Set up the hypotheses in words AND symbols. b. Check any appropriate conditions to make an inference about the population of all Cranberry Township Starbucks customers. Use the equation editor to show specific symbols. [Go to the INSERT tab Equation (with the Pi symbol)] c. Looking at your hypotheses and confidence interval from #6, would you say your results are statistically significant? Explain. d. Confirm your results with a hypothesis test. Open MINITAB, and open your file with the Starbucks data. Go to STAT Basic Statistics 1 Proportion. Click on the radio button next to “Summarized Data.” Type in your ‘n’ and ‘x’ values. Next, click on “Options. Put your hypothesized proportion (𝑝0 ) in for your test proportion. Next, define your alternative symbol in line with your response to #7a. Lastly, check the box next to “use test and interval based on Normal distribution.” Copy and paste your results below (you may also paste a screenshot). e. What does this P-value mean? Write a sentence or two explaining the P-value in context, and your conclusion. Part 2: Sports Does a home field advantage exist in sports? To test this, you will research a team’s record at home and on the road for at least the past 30 seasons in the NFL, MLB, NHL, or NBA. Calculate the home and road ̂ 𝑜𝑓 𝑤𝑖𝑛𝑠 𝑎𝑡 ℎ𝑜𝑚𝑒 𝑇𝑜𝑡𝑎𝑙 𝑛𝑢𝑚𝑏𝑒𝑟 winning percentage for that team (𝑃𝐻𝑜𝑚𝑒 = 𝑇𝑜𝑡𝑎𝑙 𝑛𝑢𝑚𝑏𝑒𝑟 𝑜𝑓 𝑔𝑎𝑚𝑒𝑠 𝑝𝑙𝑎𝑦𝑒𝑑 𝑎𝑡 ℎ𝑜𝑚𝑒 and 𝑃𝑅𝑜𝑎𝑑 = 𝑇𝑜𝑡𝑎𝑙 𝑛𝑢𝑚𝑏𝑒𝑟 𝑜𝑓 𝑤𝑖𝑛𝑠 𝑎𝑤𝑎𝑦 ). 𝑇𝑜𝑡𝑎𝑙 𝑛𝑢𝑚𝑏𝑒𝑟 𝑜𝑓 𝑔𝑎𝑚𝑒𝑠 𝑝𝑙𝑎𝑦𝑒𝑑 𝑎𝑤𝑎𝑦 You will be scored on the authenticity and accuracy of your data and calculations (be sure to include the source of your data), as well as the detail of the entire process (including the hypotheses, proper z-test, conclusions, and interpretation of conclusions to answer the question). 8. What type of inference test will you conduct to test the claim that there is a difference between the proportions of wins at home than the proportion of wins on the road? Explain. 9. Set up your hypotheses in words and symbols. Depending on your sample data, you can work to prove a difference between the wins away and at home, or you can work to prove a home-field advantage. This is your choice! 10. Check your conditions. Use the equation editor to show specific symbols. [Go to the INSERT tab Equation (with the Pi symbol)] 11. Conduct the test and find the test statistic and the P-value. Open MINITAB. Go to STAT Basic Statistics 2 Proportions. Click on the radio button next to “Summarized Data.” Type in your ‘n’ and ‘x’ values for each sample (home and away). Next, click on “Options.” Define your alternative symbol in line with your response to #9. Lastly, check the box next to “use pooled estimate of p for test.” Copy and paste your results below (you may also paste a screenshot). 12. What is your conclusion? Do you think there is a home-field advantage?


