AP Statistics Name: Practice Worksheet on Chapter 15 Date: Use
advertisement
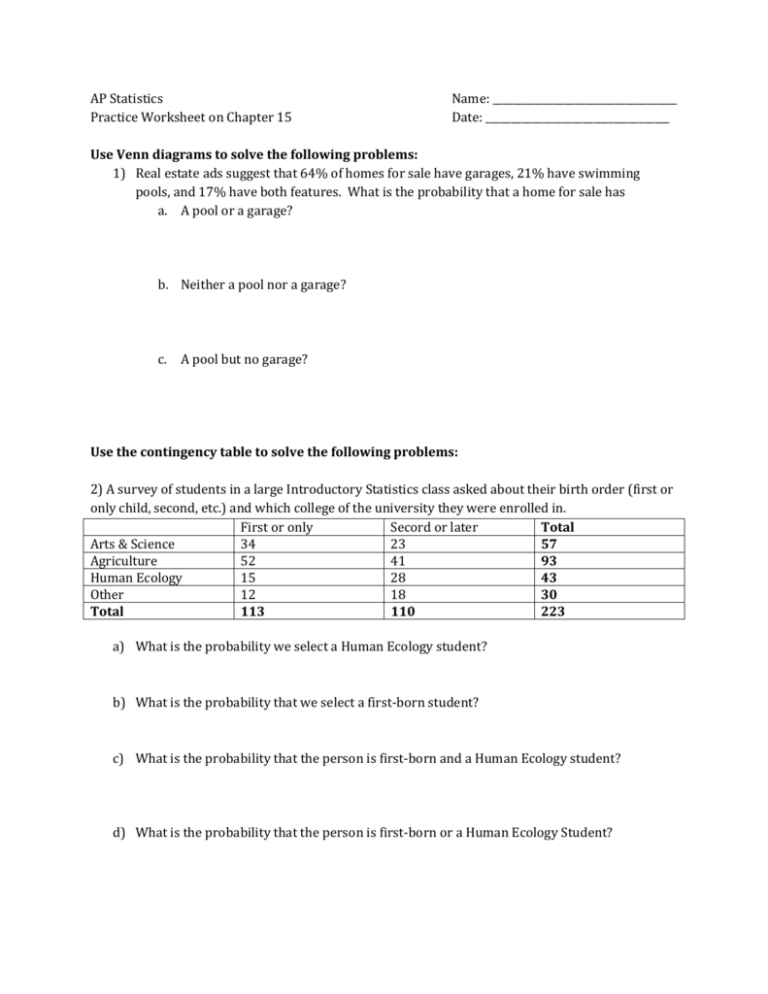
AP Statistics Practice Worksheet on Chapter 15 Name: ____________________________________ Date: ____________________________________ Use Venn diagrams to solve the following problems: 1) Real estate ads suggest that 64% of homes for sale have garages, 21% have swimming pools, and 17% have both features. What is the probability that a home for sale has a. A pool or a garage? b. Neither a pool nor a garage? c. A pool but no garage? Use the contingency table to solve the following problems: 2) A survey of students in a large Introductory Statistics class asked about their birth order (first or only child, second, etc.) and which college of the university they were enrolled in. First or only Secord or later Total Arts & Science 34 23 57 Agriculture 52 41 93 Human Ecology 15 28 43 Other 12 18 30 Total 113 110 223 a) What is the probability we select a Human Ecology student? b) What is the probability that we select a first-born student? c) What is the probability that the person is first-born and a Human Ecology student? d) What is the probability that the person is first-born or a Human Ecology Student? 3) In its monthly report, the local animal shelter states that it currently has 24 dogs and 18 cats available for adoption. Eight of the dogs and 6 and of the cats are male. Find each of the following conditional probabilities if an animal is selected at random. a. The pet is male, given that it is a cat. b. The pet is a cat given that it is a female. c. The pet is female, given that it is a dog. Use tree diagrams to solve the following problems: 4) Only 5% of male high school athletes go onto play at the college level. Of these, only 1.7% enter major league professional sports. A few high school athletes that do not compete at the college level go straight into professional sports (.01%). What is the probability that a male high school athlete will play professional sports? 5) Microcomputers are shipped to the University bookstore from three factories A, B, and C. You know that factory A produces 20% defective microcomputers, whereas B produces 10% defectives and C only 5% defectives. The manager in the store receives a new shipment of microcomputers and discovers that 40% are from factory C, 40% are from factory B, and 20% are from factory A.


