Brook Side Nov. 5, 2012 Science Period 6,
advertisement
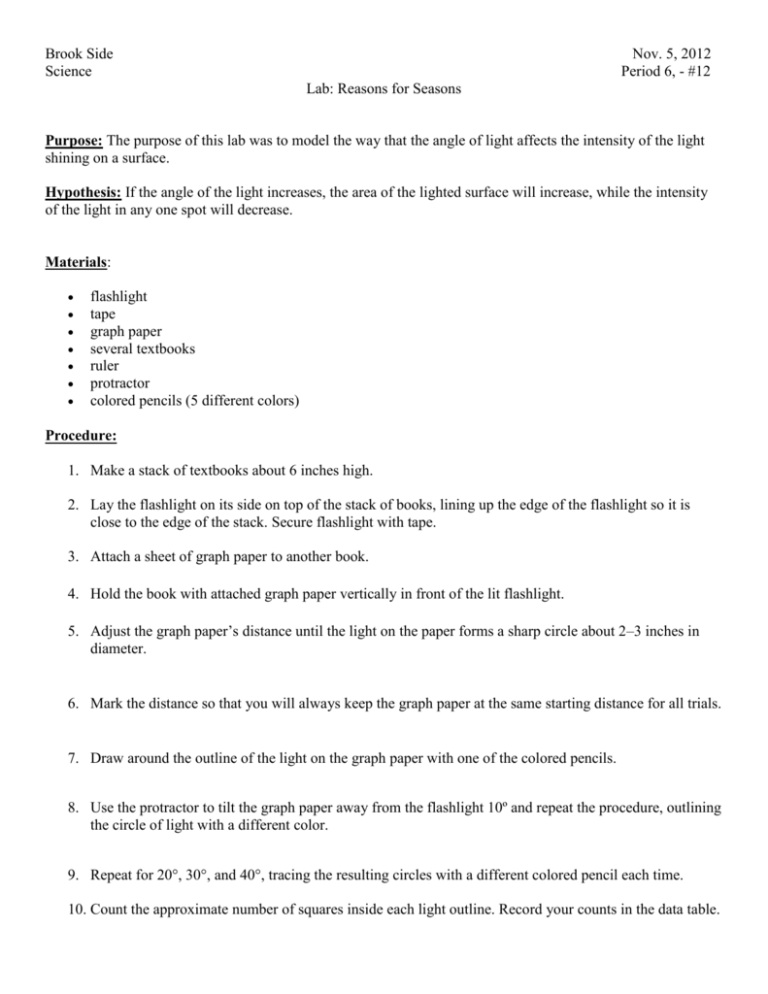
Brook Side Science Nov. 5, 2012 Period 6, - #12 Lab: Reasons for Seasons Purpose: The purpose of this lab was to model the way that the angle of light affects the intensity of the light shining on a surface. Hypothesis: If the angle of the light increases, the area of the lighted surface will increase, while the intensity of the light in any one spot will decrease. Materials: flashlight tape graph paper several textbooks ruler protractor colored pencils (5 different colors) Procedure: 1. Make a stack of textbooks about 6 inches high. 2. Lay the flashlight on its side on top of the stack of books, lining up the edge of the flashlight so it is close to the edge of the stack. Secure flashlight with tape. 3. Attach a sheet of graph paper to another book. 4. Hold the book with attached graph paper vertically in front of the lit flashlight. 5. Adjust the graph paper’s distance until the light on the paper forms a sharp circle about 2–3 inches in diameter. 6. Mark the distance so that you will always keep the graph paper at the same starting distance for all trials. 7. Draw around the outline of the light on the graph paper with one of the colored pencils. 8. Use the protractor to tilt the graph paper away from the flashlight 10º and repeat the procedure, outlining the circle of light with a different color. 9. Repeat for 20°, 30°, and 40°, tracing the resulting circles with a different colored pencil each time. 10. Count the approximate number of squares inside each light outline. Record your counts in the data table. Data Table: Number of Lighted Squares Angle of light (degrees) 0° Number of squares within the outline (group results) Class Average Number of Squares within the outline. 10° 20° 30° 40° 38 64 87 102 148 54 79 105 143 176 Observations: When the book was held straight up and down, the circle of light shining on the graph paper was very sharply defined. It was about 2 inches in diameter. As the book was tipped back and the angle of light increased, the area covered by the light became larger and the outline was less sharp. In addition, the shape of the lighted area was less circular and more irregular. As the light was spread out over a greater area, the light in any one point was dimmer. The area lit up was smallest and the concentration of light the greatest at 0 degrees. Size and brightness changed progressively as the angle increased, with the area increasing along with the angle and the brightness decreasing as the angle increased, so that the area of light was the largest and the concentration of light weakest at the 40 degree angle. Questions/Analysis: 1. The independent variable in the Reason for the Seasons lab was the angle of the light. By tilting the book at an angle away from the flashlight, we also changed the angle of the light shining onto the graph paper. 2. The dependent variable in this lab was the size of the area on the graph paper that the light shone. We measured the size of this area by counting the number of squares that were in the light. 3. In this lab, we were demonstrating how the angle of light affects the amount and intensity of light shining on a surface. Since the angle of the light was our independent variable, this is the only thing we could change and all other factors that might affect our results had to be kept constant. An example of a constant in this experiment is the distance between the flashlight and the graph paper. We had to hold the graph paper at the same distance every time we changed the angle because changing the distance could have affected how much light shone on the graph paper. Whenever you change more than one variable, you do not know which one caused your results. 4. In addition to the starting distance, some other constants in this experiment were the height of the stack of books, the amount of light shining from the flashlight, and the size of squares on the graph paper. It was important to keep these factors constant because changing them could have affected the amount of light shining on the paper. For example, if we had used a larger flashlight for some trials, we would not be able to say if the larger area of light on the paper was due to the angle or to the flashlight itself. 5. As the degree of tilt increased, so did the number of squares inside the outline. The light from the flashlight was more spread out when the angle was greater. For example, when the book was straight up and down, 75 squares were lit up. As we tilted the graph paper farther and farther. More and more squares were contained within the lit up area. By the time we reached the largest angle, 40°, there were 300 squares within the lighted outline. (note: I made up this data; students should cite their actual data.) 6. As the degree of tilt increased, the light became dimmer, or less intense. The same amount of light was being spread out over a larger area, therefore each individual point within the outline received less light than it had when the angle of the graph paper away from the light source was smaller. 7. This experiment models the way that the angle of sunlight reaching the earth determines the season. Earth’s seasons are caused by the varying amount and intensity of sunlight at different times of year. The greater the angle, the less concentrated, or intense, is the light shining on the surface. The light spreads out more, but at any given point it is dimmer. During our summer, the northern hemisphere is tilted toward the sun and therefore receives more direct, concentrated sunlight. During our winter, the northern hemisphere is tilted away from the sun, so the light is spread out and less intense. 8. When the book is held vertically, or at 0 degrees of tilt, we see light similar to what North America experiences in summer. It is concentrated into a smaller area and therefore more intense. If we want to model the actual tilt of the planet toward the sun, we’d have to angle the book toward the flashlight, but we did not do that. 9. When the book is tilted 20 degrees away from the light source, it produces light similar to what North America experiences in winter. This is because the earth is tilted 23.5 degrees on its axis and 20 degrees is the closest angle we used. 10. As stated earlier (question #7), the experiment helps us to see how the angle of light affects its concentration. Our data indicates a direct relationship between the angle of the light shining onto a surface and the concentration of the light that hits that surface. As the angle away from the light source increased, the concentration of light hitting the surface decreased. Every time we increased the angle of tilt, the area lit up increased, which caused the light to be more spread out and less concentrated. Conclusion: The purpose of this experiment was to model the way that the angle of light affects its intensity. By doing this, we can better understand how seasons on Earth are caused by the differing angle of light hitting parts of Earth’s surface at different times of year. The hypothesis that increasing the angle of the light will increase the area on a surface that is lit up was supported by the data. For example, when the light hit the surface when it was at a 0 degree angle, or straight up and down, only 54 squares were lit up. As the angle was increased, the number of lighted squares also increased steadily. The largest number of squares, 176, were lit up when the angle was greatest at 40 degrees away from the vertical. In addition, it was observed that as the area of light became more spread out, the intensity of the light in any one spot decreased. This is because the same amount of light coming from the flashlight was spread out over a greater area on the graph paper. This experiment models the way Earth experiences seasons. During winter in the northern hemisphere, the north pole is angled away from the sun. The sun’s light is then hitting the northern hemisphere at an angle. The light is spread out over a large area. Any one point in this area receives less solar radiation than a point in the southern hemisphere, which would be angled toward the sun at that time, this receiving more intense and concentrated sunlight, which results in warmer and longer days. Possible sources of error in this experiment could be due to miscounting the number of squares or not making sure to carefully hold the surface at the same distance from the flashlight. In addition, there could be mechanical error caused by batteries or bulbs wearing out with use. It might be interesting to conduct a further experiment during which we could tilt the lighted surface towards rather than away from the flashlight. As the paper is angled toward the light, it would be expected that the area lit up would become smaller and smaller and the brightness of the light more and more concentrated. This experiment provides a model of the cause of seasons on Earth, the angle of sunlight on the earth at different times of the year due to the fact that Earth is tilted on its axis. The tilt is always in the same directions, so as the earth revolves around the sun, at different points in its orbit, the northern hemisphere will be pointing toward or away from the sun. Your line graph should either be just after the data table or at the very end of the lab report. It may be hand drawn or done on the computer. It is important that your graph: 1. Has a specific and descriptive title. 2. Is accurately numbered on both axes – equal intervals, numbers lined up with a line, (0,0) at origin, etc. 3. Has specific labels for both axes. 4. Has gridlines. 5. If done by hand, is done neatly with a pencil and a ruler. Reasons for Seasons: Relationship between angle of light and area of lighted surface 200 Number of Lighted Squares 180 160 140 120 100 80 60 40 20 0 0 5 10 15 20 25 30 Angle of Light (Degrees) 35 40 45

